Immigrants from Zaire vs Spanish 12th Grade, No Diploma
COMPARE
Immigrants from Zaire
Spanish
12th Grade, No Diploma
12th Grade, No Diploma Comparison
Immigrants from Zaire
Spanish
90.3%
12TH GRADE, NO DIPLOMA
4.6/ 100
METRIC RATING
226th/ 347
METRIC RANK
91.1%
12TH GRADE, NO DIPLOMA
43.7/ 100
METRIC RATING
178th/ 347
METRIC RANK
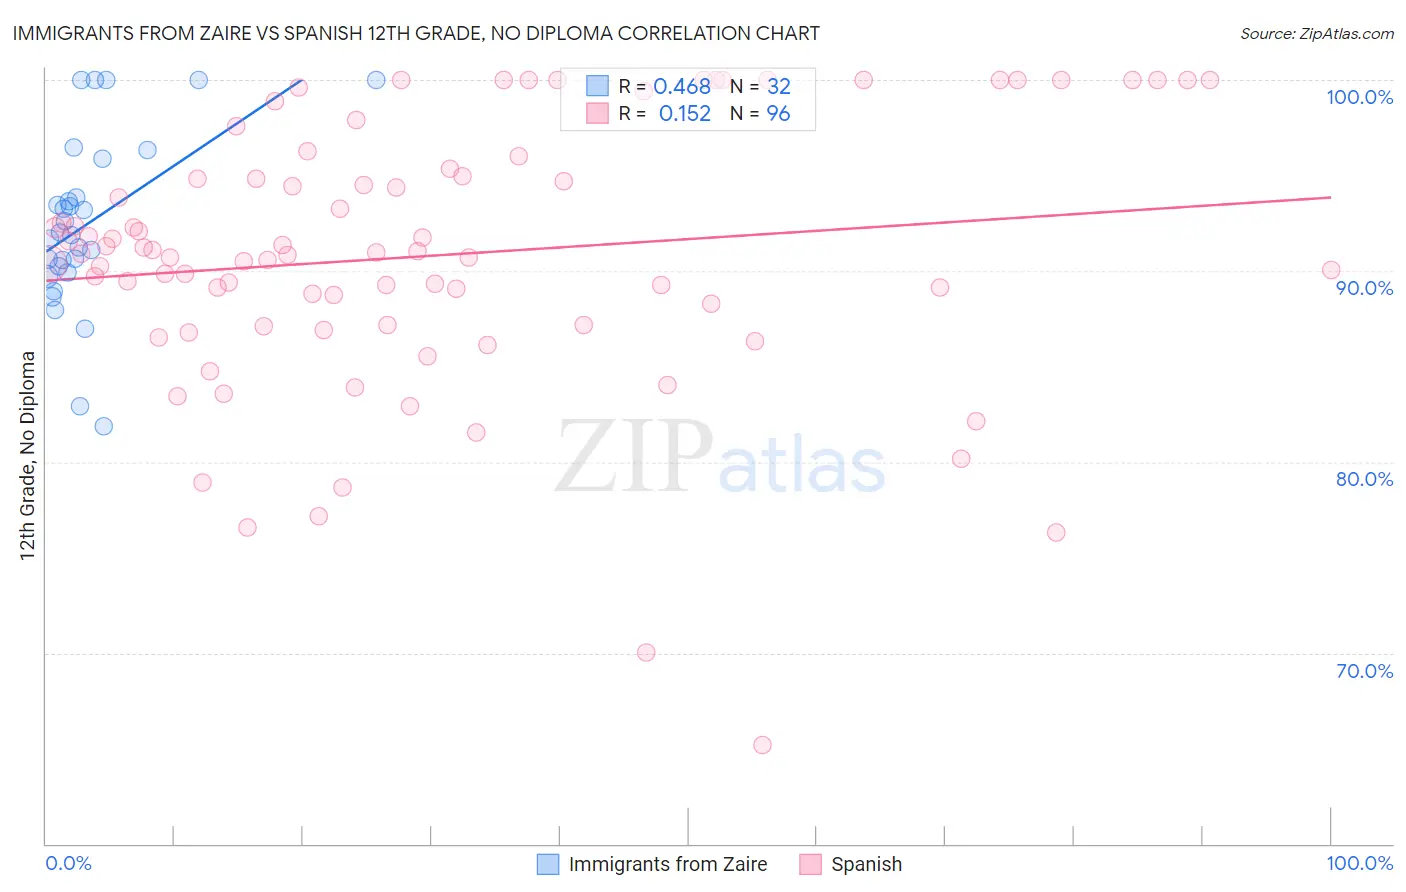
Immigrants from Zaire vs Spanish 12th Grade, No Diploma Correlation Chart
The statistical analysis conducted on geographies consisting of 107,255,805 people shows a moderate positive correlation between the proportion of Immigrants from Zaire and percentage of population with at least 12th grade (no diploma) education in the United States with a correlation coefficient (R) of 0.468 and weighted average of 90.3%. Similarly, the statistical analysis conducted on geographies consisting of 422,189,152 people shows a poor positive correlation between the proportion of Spanish and percentage of population with at least 12th grade (no diploma) education in the United States with a correlation coefficient (R) of 0.152 and weighted average of 91.1%, a difference of 0.86%.
12th Grade, No Diploma Correlation Summary
| Measurement | Immigrants from Zaire | Spanish |
| Minimum | 81.9% | 65.2% |
| Maximum | 100.0% | 100.0% |
| Range | 18.1% | 34.8% |
| Mean | 92.5% | 90.8% |
| Median | 91.9% | 90.9% |
| Interquartile 25% (IQ1) | 90.1% | 87.2% |
| Interquartile 75% (IQ3) | 94.9% | 95.1% |
| Interquartile Range (IQR) | 4.8% | 8.0% |
| Standard Deviation (Sample) | 4.6% | 7.0% |
| Standard Deviation (Population) | 4.5% | 6.9% |
Similar Demographics by 12th Grade, No Diploma
Demographics Similar to Immigrants from Zaire by 12th Grade, No Diploma
In terms of 12th grade, no diploma, the demographic groups most similar to Immigrants from Zaire are Immigrants from Panama (90.3%, a difference of 0.010%), Chickasaw (90.3%, a difference of 0.010%), Nigerian (90.3%, a difference of 0.010%), South American (90.3%, a difference of 0.030%), and Immigrants from Somalia (90.4%, a difference of 0.040%).
| Demographics | Rating | Rank | 12th Grade, No Diploma |
| Uruguayans | 7.0 /100 | #219 | Tragic 90.4% |
| Colombians | 6.6 /100 | #220 | Tragic 90.4% |
| Immigrants | Liberia | 5.7 /100 | #221 | Tragic 90.4% |
| Immigrants | Somalia | 5.3 /100 | #222 | Tragic 90.4% |
| South Americans | 5.0 /100 | #223 | Tragic 90.3% |
| Immigrants | Panama | 4.8 /100 | #224 | Tragic 90.3% |
| Chickasaw | 4.8 /100 | #225 | Tragic 90.3% |
| Immigrants | Zaire | 4.6 /100 | #226 | Tragic 90.3% |
| Nigerians | 4.5 /100 | #227 | Tragic 90.3% |
| Creek | 3.9 /100 | #228 | Tragic 90.3% |
| Immigrants | Bahamas | 3.6 /100 | #229 | Tragic 90.2% |
| Immigrants | Philippines | 2.8 /100 | #230 | Tragic 90.2% |
| Peruvians | 2.7 /100 | #231 | Tragic 90.2% |
| Blackfeet | 2.4 /100 | #232 | Tragic 90.1% |
| Immigrants | Thailand | 2.3 /100 | #233 | Tragic 90.1% |
Demographics Similar to Spanish by 12th Grade, No Diploma
In terms of 12th grade, no diploma, the demographic groups most similar to Spanish are Immigrants from Chile (91.1%, a difference of 0.0%), Immigrants from Syria (91.1%, a difference of 0.040%), Sierra Leonean (91.1%, a difference of 0.050%), Guamanian/Chamorro (91.0%, a difference of 0.050%), and Iroquois (91.1%, a difference of 0.060%).
| Demographics | Rating | Rank | 12th Grade, No Diploma |
| Immigrants | Morocco | 51.4 /100 | #171 | Average 91.2% |
| Bermudans | 50.8 /100 | #172 | Average 91.2% |
| Bolivians | 50.4 /100 | #173 | Average 91.2% |
| Immigrants | Nepal | 50.0 /100 | #174 | Average 91.2% |
| Immigrants | Western Asia | 49.0 /100 | #175 | Average 91.2% |
| Iroquois | 48.5 /100 | #176 | Average 91.1% |
| Sierra Leoneans | 47.7 /100 | #177 | Average 91.1% |
| Spanish | 43.7 /100 | #178 | Average 91.1% |
| Immigrants | Chile | 43.3 /100 | #179 | Average 91.1% |
| Immigrants | Syria | 40.3 /100 | #180 | Average 91.1% |
| Guamanians/Chamorros | 39.5 /100 | #181 | Fair 91.0% |
| Immigrants | Nonimmigrants | 38.8 /100 | #182 | Fair 91.0% |
| Osage | 38.3 /100 | #183 | Fair 91.0% |
| Spaniards | 36.2 /100 | #184 | Fair 91.0% |
| Sudanese | 34.4 /100 | #185 | Fair 91.0% |