Immigrants from Zaire vs Immigrants from Bosnia and Herzegovina Bachelor's Degree
COMPARE
Immigrants from Zaire
Immigrants from Bosnia and Herzegovina
Bachelor's Degree
Bachelor's Degree Comparison
Immigrants from Zaire
Immigrants from Bosnia and Herzegovina
36.8%
BACHELOR'S DEGREE
25.3/ 100
METRIC RATING
202nd/ 347
METRIC RANK
37.6%
BACHELOR'S DEGREE
43.4/ 100
METRIC RATING
182nd/ 347
METRIC RANK
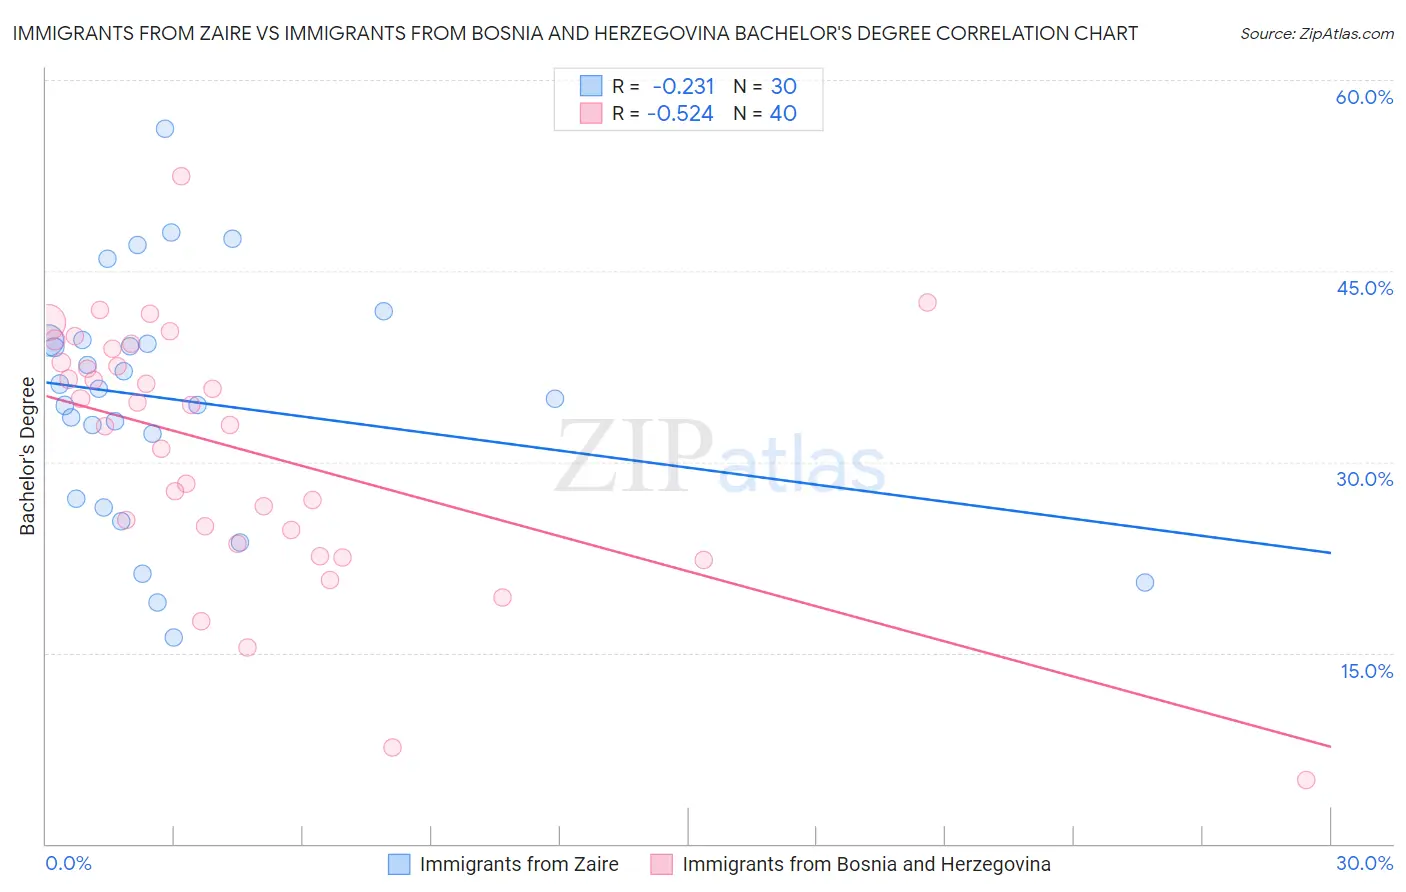
Immigrants from Zaire vs Immigrants from Bosnia and Herzegovina Bachelor's Degree Correlation Chart
The statistical analysis conducted on geographies consisting of 107,252,315 people shows a weak negative correlation between the proportion of Immigrants from Zaire and percentage of population with at least bachelor's degree education in the United States with a correlation coefficient (R) of -0.231 and weighted average of 36.8%. Similarly, the statistical analysis conducted on geographies consisting of 156,817,414 people shows a substantial negative correlation between the proportion of Immigrants from Bosnia and Herzegovina and percentage of population with at least bachelor's degree education in the United States with a correlation coefficient (R) of -0.524 and weighted average of 37.6%, a difference of 2.1%.
Bachelor's Degree Correlation Summary
| Measurement | Immigrants from Zaire | Immigrants from Bosnia and Herzegovina |
| Minimum | 16.2% | 5.0% |
| Maximum | 56.2% | 52.4% |
| Range | 40.0% | 47.4% |
| Mean | 34.8% | 30.9% |
| Median | 35.4% | 33.7% |
| Interquartile 25% (IQ1) | 27.1% | 24.1% |
| Interquartile 75% (IQ3) | 39.5% | 38.3% |
| Interquartile Range (IQR) | 12.4% | 14.2% |
| Standard Deviation (Sample) | 9.4% | 10.0% |
| Standard Deviation (Population) | 9.3% | 9.9% |
Demographics Similar to Immigrants from Zaire and Immigrants from Bosnia and Herzegovina by Bachelor's Degree
In terms of bachelor's degree, the demographic groups most similar to Immigrants from Zaire are Immigrants from South Eastern Asia (36.8%, a difference of 0.010%), Immigrants from Ghana (36.9%, a difference of 0.27%), Immigrants from Costa Rica (36.9%, a difference of 0.28%), Welsh (37.0%, a difference of 0.49%), and Czechoslovakian (37.0%, a difference of 0.50%). Similarly, the demographic groups most similar to Immigrants from Bosnia and Herzegovina are Senegalese (37.5%, a difference of 0.13%), Scandinavian (37.5%, a difference of 0.17%), Immigrants from Peru (37.5%, a difference of 0.21%), Norwegian (37.5%, a difference of 0.31%), and English (37.4%, a difference of 0.38%).
| Demographics | Rating | Rank | Bachelor's Degree |
| Immigrants | Bosnia and Herzegovina | 43.4 /100 | #182 | Average 37.6% |
| Senegalese | 42.2 /100 | #183 | Average 37.5% |
| Scandinavians | 41.7 /100 | #184 | Average 37.5% |
| Immigrants | Peru | 41.3 /100 | #185 | Average 37.5% |
| Norwegians | 40.4 /100 | #186 | Average 37.5% |
| English | 39.7 /100 | #187 | Fair 37.4% |
| Immigrants | Oceania | 37.3 /100 | #188 | Fair 37.3% |
| Slovaks | 36.9 /100 | #189 | Fair 37.3% |
| Swiss | 34.1 /100 | #190 | Fair 37.2% |
| Nigerians | 33.9 /100 | #191 | Fair 37.2% |
| Immigrants | Vietnam | 32.1 /100 | #192 | Fair 37.1% |
| Yugoslavians | 31.5 /100 | #193 | Fair 37.1% |
| Belgians | 29.9 /100 | #194 | Fair 37.0% |
| Koreans | 29.8 /100 | #195 | Fair 37.0% |
| Celtics | 29.5 /100 | #196 | Fair 37.0% |
| Czechoslovakians | 29.2 /100 | #197 | Fair 37.0% |
| Welsh | 29.1 /100 | #198 | Fair 37.0% |
| Immigrants | Costa Rica | 27.4 /100 | #199 | Fair 36.9% |
| Immigrants | Ghana | 27.4 /100 | #200 | Fair 36.9% |
| Immigrants | South Eastern Asia | 25.4 /100 | #201 | Fair 36.8% |
| Immigrants | Zaire | 25.3 /100 | #202 | Fair 36.8% |