Immigrants from Western Asia vs Immigrants from Panama 2nd Grade
COMPARE
Immigrants from Western Asia
Immigrants from Panama
2nd Grade
2nd Grade Comparison
Immigrants from Western Asia
Immigrants from Panama
97.6%
2ND GRADE
2.1/ 100
METRIC RATING
232nd/ 347
METRIC RANK
97.6%
2ND GRADE
5.1/ 100
METRIC RATING
219th/ 347
METRIC RANK
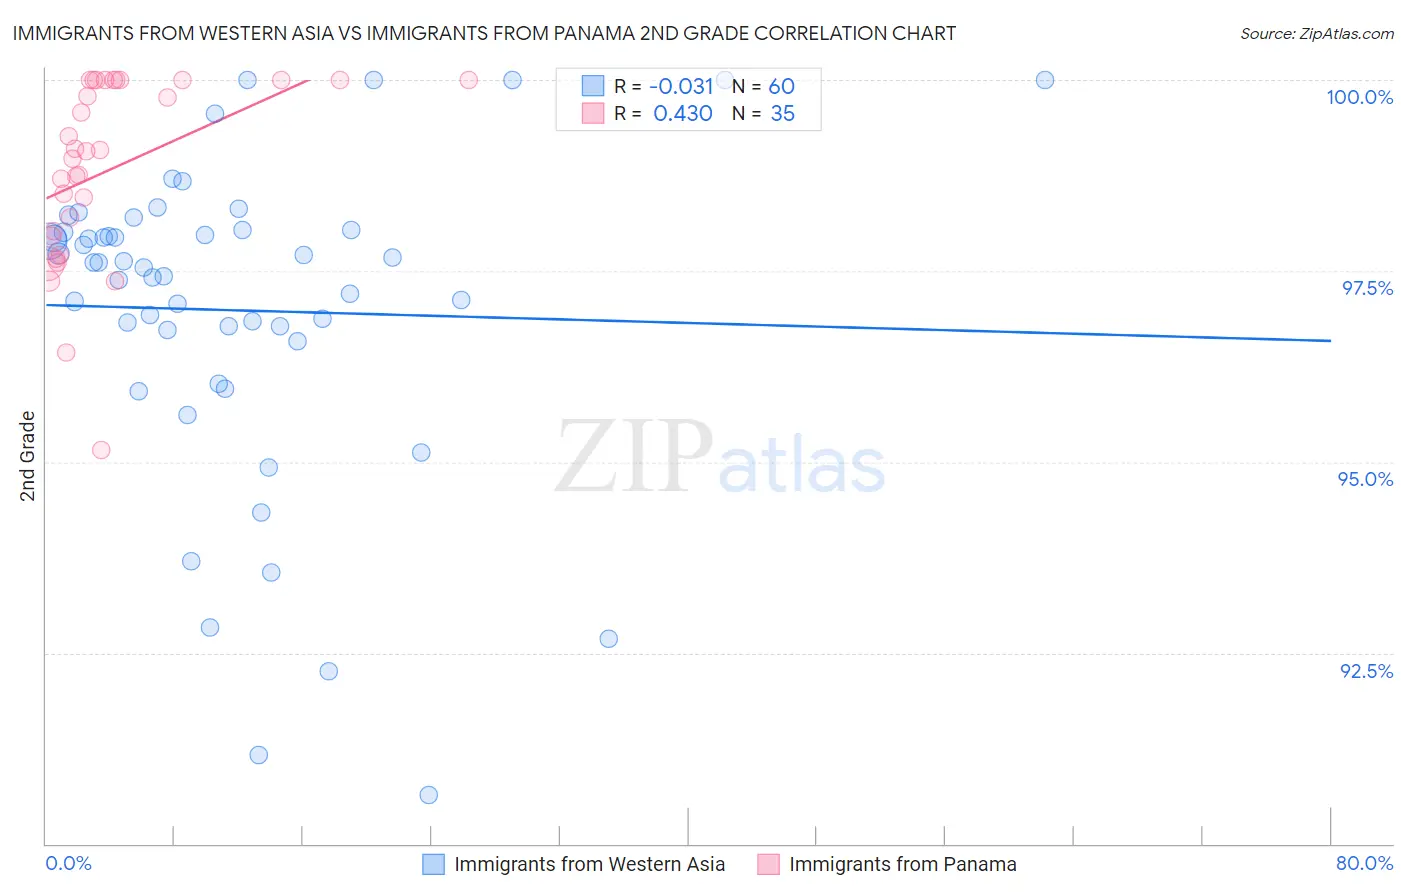
Immigrants from Western Asia vs Immigrants from Panama 2nd Grade Correlation Chart
The statistical analysis conducted on geographies consisting of 404,424,892 people shows no correlation between the proportion of Immigrants from Western Asia and percentage of population with at least 2nd grade education in the United States with a correlation coefficient (R) of -0.031 and weighted average of 97.6%. Similarly, the statistical analysis conducted on geographies consisting of 221,182,871 people shows a moderate positive correlation between the proportion of Immigrants from Panama and percentage of population with at least 2nd grade education in the United States with a correlation coefficient (R) of 0.430 and weighted average of 97.6%, a difference of 0.070%.
2nd Grade Correlation Summary
| Measurement | Immigrants from Western Asia | Immigrants from Panama |
| Minimum | 90.6% | 95.1% |
| Maximum | 100.0% | 100.0% |
| Range | 9.4% | 4.9% |
| Mean | 97.0% | 98.8% |
| Median | 97.6% | 99.1% |
| Interquartile 25% (IQ1) | 96.6% | 98.0% |
| Interquartile 75% (IQ3) | 98.0% | 100.0% |
| Interquartile Range (IQR) | 1.4% | 2.0% |
| Standard Deviation (Sample) | 2.1% | 1.2% |
| Standard Deviation (Population) | 2.1% | 1.2% |
Demographics Similar to Immigrants from Western Asia and Immigrants from Panama by 2nd Grade
In terms of 2nd grade, the demographic groups most similar to Immigrants from Western Asia are Immigrants from Uruguay (97.6%, a difference of 0.0%), Immigrants from Malaysia (97.6%, a difference of 0.0%), Immigrants from Pakistan (97.6%, a difference of 0.010%), Colombian (97.6%, a difference of 0.010%), and Immigrants from Costa Rica (97.6%, a difference of 0.030%). Similarly, the demographic groups most similar to Immigrants from Panama are Immigrants from Morocco (97.6%, a difference of 0.0%), Sudanese (97.7%, a difference of 0.010%), Iraqi (97.6%, a difference of 0.010%), Immigrants from Sudan (97.6%, a difference of 0.010%), and Bahamian (97.7%, a difference of 0.020%).
| Demographics | Rating | Rank | 2nd Grade |
| Bahamians | 6.8 /100 | #215 | Tragic 97.7% |
| South American Indians | 6.7 /100 | #216 | Tragic 97.7% |
| Uruguayans | 6.2 /100 | #217 | Tragic 97.7% |
| Sudanese | 5.7 /100 | #218 | Tragic 97.7% |
| Immigrants | Panama | 5.1 /100 | #219 | Tragic 97.6% |
| Immigrants | Morocco | 5.0 /100 | #220 | Tragic 97.6% |
| Iraqis | 4.6 /100 | #221 | Tragic 97.6% |
| Immigrants | Sudan | 4.5 /100 | #222 | Tragic 97.6% |
| Sierra Leoneans | 4.3 /100 | #223 | Tragic 97.6% |
| Immigrants | Zaire | 4.3 /100 | #224 | Tragic 97.6% |
| Tongans | 4.3 /100 | #225 | Tragic 97.6% |
| Immigrants | Syria | 4.0 /100 | #226 | Tragic 97.6% |
| Immigrants | Nepal | 4.0 /100 | #227 | Tragic 97.6% |
| Sub-Saharan Africans | 3.4 /100 | #228 | Tragic 97.6% |
| Immigrants | Costa Rica | 3.1 /100 | #229 | Tragic 97.6% |
| Senegalese | 3.1 /100 | #230 | Tragic 97.6% |
| Immigrants | Pakistan | 2.3 /100 | #231 | Tragic 97.6% |
| Immigrants | Western Asia | 2.1 /100 | #232 | Tragic 97.6% |
| Immigrants | Uruguay | 2.1 /100 | #233 | Tragic 97.6% |
| Immigrants | Malaysia | 2.0 /100 | #234 | Tragic 97.6% |
| Colombians | 1.9 /100 | #235 | Tragic 97.6% |