Immigrants from Western Asia vs Arapaho 2nd Grade
COMPARE
Immigrants from Western Asia
Arapaho
2nd Grade
2nd Grade Comparison
Immigrants from Western Asia
Arapaho
97.6%
2ND GRADE
2.1/ 100
METRIC RATING
232nd/ 347
METRIC RANK
98.5%
2ND GRADE
100.0/ 100
METRIC RATING
28th/ 347
METRIC RANK
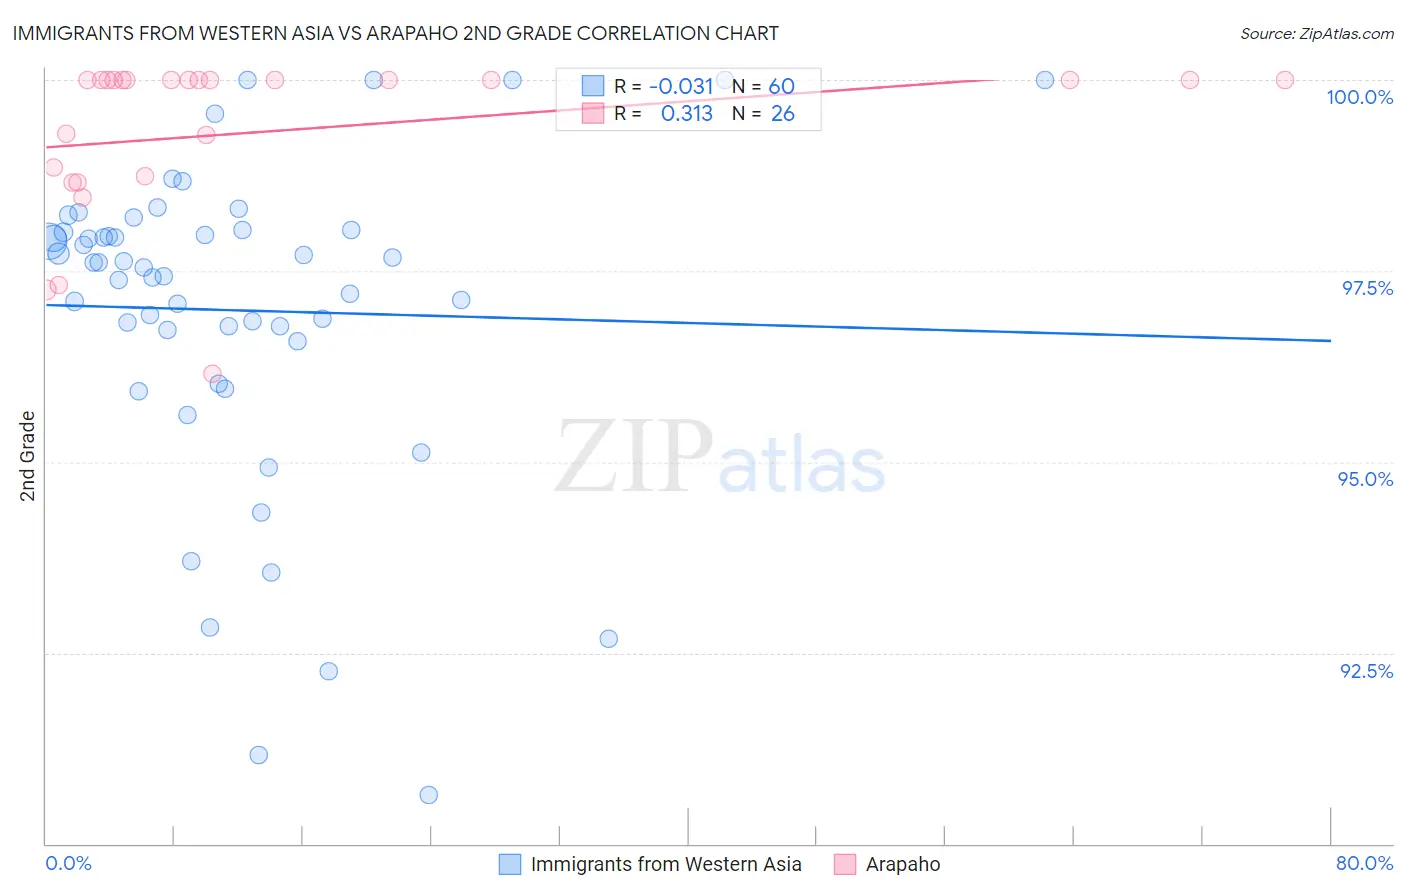
Immigrants from Western Asia vs Arapaho 2nd Grade Correlation Chart
The statistical analysis conducted on geographies consisting of 404,424,892 people shows no correlation between the proportion of Immigrants from Western Asia and percentage of population with at least 2nd grade education in the United States with a correlation coefficient (R) of -0.031 and weighted average of 97.6%. Similarly, the statistical analysis conducted on geographies consisting of 29,780,295 people shows a mild positive correlation between the proportion of Arapaho and percentage of population with at least 2nd grade education in the United States with a correlation coefficient (R) of 0.313 and weighted average of 98.5%, a difference of 0.97%.
2nd Grade Correlation Summary
| Measurement | Immigrants from Western Asia | Arapaho |
| Minimum | 90.6% | 96.2% |
| Maximum | 100.0% | 100.0% |
| Range | 9.4% | 3.8% |
| Mean | 97.0% | 99.3% |
| Median | 97.6% | 100.0% |
| Interquartile 25% (IQ1) | 96.6% | 98.7% |
| Interquartile 75% (IQ3) | 98.0% | 100.0% |
| Interquartile Range (IQR) | 1.4% | 1.3% |
| Standard Deviation (Sample) | 2.1% | 1.1% |
| Standard Deviation (Population) | 2.1% | 1.0% |
Similar Demographics by 2nd Grade
Demographics Similar to Immigrants from Western Asia by 2nd Grade
In terms of 2nd grade, the demographic groups most similar to Immigrants from Western Asia are Immigrants from Uruguay (97.6%, a difference of 0.0%), Immigrants from Malaysia (97.6%, a difference of 0.0%), Immigrants from Pakistan (97.6%, a difference of 0.010%), Colombian (97.6%, a difference of 0.010%), and Nigerian (97.6%, a difference of 0.020%).
| Demographics | Rating | Rank | 2nd Grade |
| Tongans | 4.3 /100 | #225 | Tragic 97.6% |
| Immigrants | Syria | 4.0 /100 | #226 | Tragic 97.6% |
| Immigrants | Nepal | 4.0 /100 | #227 | Tragic 97.6% |
| Sub-Saharan Africans | 3.4 /100 | #228 | Tragic 97.6% |
| Immigrants | Costa Rica | 3.1 /100 | #229 | Tragic 97.6% |
| Senegalese | 3.1 /100 | #230 | Tragic 97.6% |
| Immigrants | Pakistan | 2.3 /100 | #231 | Tragic 97.6% |
| Immigrants | Western Asia | 2.1 /100 | #232 | Tragic 97.6% |
| Immigrants | Uruguay | 2.1 /100 | #233 | Tragic 97.6% |
| Immigrants | Malaysia | 2.0 /100 | #234 | Tragic 97.6% |
| Colombians | 1.9 /100 | #235 | Tragic 97.6% |
| Nigerians | 1.7 /100 | #236 | Tragic 97.6% |
| U.S. Virgin Islanders | 1.6 /100 | #237 | Tragic 97.6% |
| Immigrants | Eastern Asia | 1.6 /100 | #238 | Tragic 97.6% |
| Liberians | 1.6 /100 | #239 | Tragic 97.6% |
Demographics Similar to Arapaho by 2nd Grade
In terms of 2nd grade, the demographic groups most similar to Arapaho are Croatian (98.5%, a difference of 0.0%), French (98.5%, a difference of 0.0%), Welsh (98.5%, a difference of 0.010%), European (98.5%, a difference of 0.010%), and Czech (98.5%, a difference of 0.010%).
| Demographics | Rating | Rank | 2nd Grade |
| Lithuanians | 100.0 /100 | #21 | Exceptional 98.5% |
| Poles | 100.0 /100 | #22 | Exceptional 98.5% |
| Danes | 100.0 /100 | #23 | Exceptional 98.5% |
| Pennsylvania Germans | 100.0 /100 | #24 | Exceptional 98.5% |
| Scotch-Irish | 100.0 /100 | #25 | Exceptional 98.5% |
| Welsh | 100.0 /100 | #26 | Exceptional 98.5% |
| Croatians | 100.0 /100 | #27 | Exceptional 98.5% |
| Arapaho | 100.0 /100 | #28 | Exceptional 98.5% |
| French | 100.0 /100 | #29 | Exceptional 98.5% |
| Europeans | 100.0 /100 | #30 | Exceptional 98.5% |
| Czechs | 100.0 /100 | #31 | Exceptional 98.5% |
| French Canadians | 100.0 /100 | #32 | Exceptional 98.5% |
| Scandinavians | 100.0 /100 | #33 | Exceptional 98.5% |
| Chinese | 100.0 /100 | #34 | Exceptional 98.5% |
| Swiss | 100.0 /100 | #35 | Exceptional 98.5% |