Immigrants from Western Asia vs Egyptian 2nd Grade
COMPARE
Immigrants from Western Asia
Egyptian
2nd Grade
2nd Grade Comparison
Immigrants from Western Asia
Egyptians
97.6%
2ND GRADE
2.1/ 100
METRIC RATING
232nd/ 347
METRIC RANK
97.9%
2ND GRADE
44.3/ 100
METRIC RATING
181st/ 347
METRIC RANK
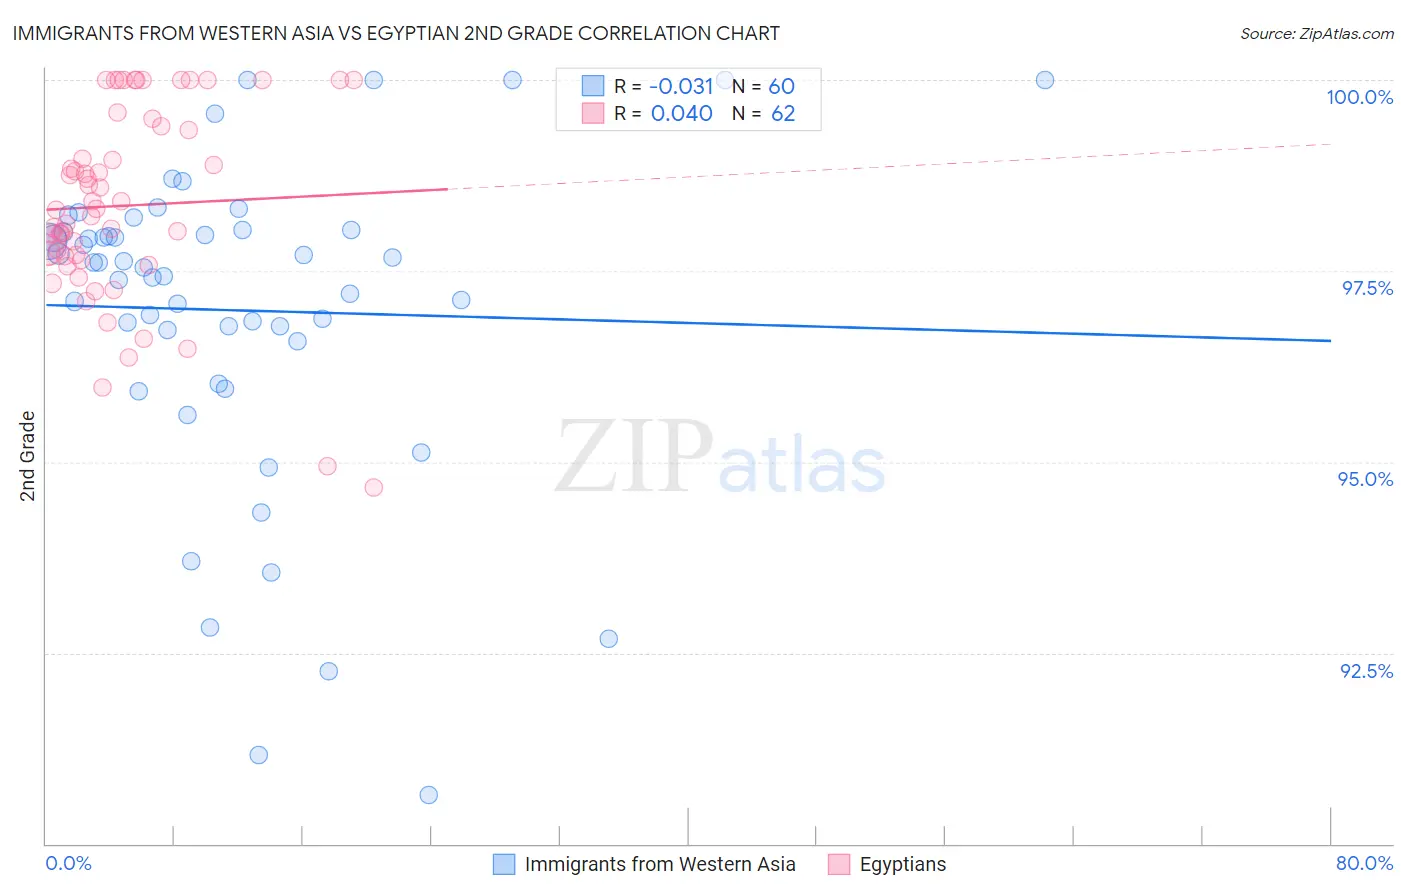
Immigrants from Western Asia vs Egyptian 2nd Grade Correlation Chart
The statistical analysis conducted on geographies consisting of 404,424,892 people shows no correlation between the proportion of Immigrants from Western Asia and percentage of population with at least 2nd grade education in the United States with a correlation coefficient (R) of -0.031 and weighted average of 97.6%. Similarly, the statistical analysis conducted on geographies consisting of 276,927,423 people shows no correlation between the proportion of Egyptians and percentage of population with at least 2nd grade education in the United States with a correlation coefficient (R) of 0.040 and weighted average of 97.9%, a difference of 0.28%.
2nd Grade Correlation Summary
| Measurement | Immigrants from Western Asia | Egyptian |
| Minimum | 90.6% | 94.7% |
| Maximum | 100.0% | 100.0% |
| Range | 9.4% | 5.3% |
| Mean | 97.0% | 98.4% |
| Median | 97.6% | 98.3% |
| Interquartile 25% (IQ1) | 96.6% | 97.7% |
| Interquartile 75% (IQ3) | 98.0% | 99.4% |
| Interquartile Range (IQR) | 1.4% | 1.7% |
| Standard Deviation (Sample) | 2.1% | 1.3% |
| Standard Deviation (Population) | 2.1% | 1.3% |
Similar Demographics by 2nd Grade
Demographics Similar to Immigrants from Western Asia by 2nd Grade
In terms of 2nd grade, the demographic groups most similar to Immigrants from Western Asia are Immigrants from Uruguay (97.6%, a difference of 0.0%), Immigrants from Malaysia (97.6%, a difference of 0.0%), Immigrants from Pakistan (97.6%, a difference of 0.010%), Colombian (97.6%, a difference of 0.010%), and Nigerian (97.6%, a difference of 0.020%).
| Demographics | Rating | Rank | 2nd Grade |
| Tongans | 4.3 /100 | #225 | Tragic 97.6% |
| Immigrants | Syria | 4.0 /100 | #226 | Tragic 97.6% |
| Immigrants | Nepal | 4.0 /100 | #227 | Tragic 97.6% |
| Sub-Saharan Africans | 3.4 /100 | #228 | Tragic 97.6% |
| Immigrants | Costa Rica | 3.1 /100 | #229 | Tragic 97.6% |
| Senegalese | 3.1 /100 | #230 | Tragic 97.6% |
| Immigrants | Pakistan | 2.3 /100 | #231 | Tragic 97.6% |
| Immigrants | Western Asia | 2.1 /100 | #232 | Tragic 97.6% |
| Immigrants | Uruguay | 2.1 /100 | #233 | Tragic 97.6% |
| Immigrants | Malaysia | 2.0 /100 | #234 | Tragic 97.6% |
| Colombians | 1.9 /100 | #235 | Tragic 97.6% |
| Nigerians | 1.7 /100 | #236 | Tragic 97.6% |
| U.S. Virgin Islanders | 1.6 /100 | #237 | Tragic 97.6% |
| Immigrants | Eastern Asia | 1.6 /100 | #238 | Tragic 97.6% |
| Liberians | 1.6 /100 | #239 | Tragic 97.6% |
Demographics Similar to Egyptians by 2nd Grade
In terms of 2nd grade, the demographic groups most similar to Egyptians are Native/Alaskan (97.9%, a difference of 0.0%), Immigrants from Sri Lanka (97.9%, a difference of 0.010%), Immigrants from Brazil (97.9%, a difference of 0.010%), Argentinean (97.9%, a difference of 0.010%), and Immigrants from Venezuela (97.9%, a difference of 0.010%).
| Demographics | Rating | Rank | 2nd Grade |
| Immigrants | Micronesia | 50.0 /100 | #174 | Average 97.9% |
| Immigrants | Bosnia and Herzegovina | 49.8 /100 | #175 | Average 97.9% |
| Immigrants | Sri Lanka | 48.7 /100 | #176 | Average 97.9% |
| Immigrants | Brazil | 46.6 /100 | #177 | Average 97.9% |
| Argentineans | 46.3 /100 | #178 | Average 97.9% |
| Immigrants | Venezuela | 46.1 /100 | #179 | Average 97.9% |
| Natives/Alaskans | 44.3 /100 | #180 | Average 97.9% |
| Egyptians | 44.3 /100 | #181 | Average 97.9% |
| Portuguese | 42.4 /100 | #182 | Average 97.8% |
| Immigrants | Poland | 42.2 /100 | #183 | Average 97.8% |
| Immigrants | Belarus | 41.5 /100 | #184 | Average 97.8% |
| Immigrants | Argentina | 40.6 /100 | #185 | Average 97.8% |
| Arabs | 36.9 /100 | #186 | Fair 97.8% |
| Pakistanis | 36.1 /100 | #187 | Fair 97.8% |
| Immigrants | Kazakhstan | 35.6 /100 | #188 | Fair 97.8% |