Immigrants from Western Asia vs Iroquois Bachelor's Degree
COMPARE
Immigrants from Western Asia
Iroquois
Bachelor's Degree
Bachelor's Degree Comparison
Immigrants from Western Asia
Iroquois
42.3%
BACHELOR'S DEGREE
99.2/ 100
METRIC RATING
84th/ 347
METRIC RANK
33.2%
BACHELOR'S DEGREE
0.7/ 100
METRIC RATING
255th/ 347
METRIC RANK
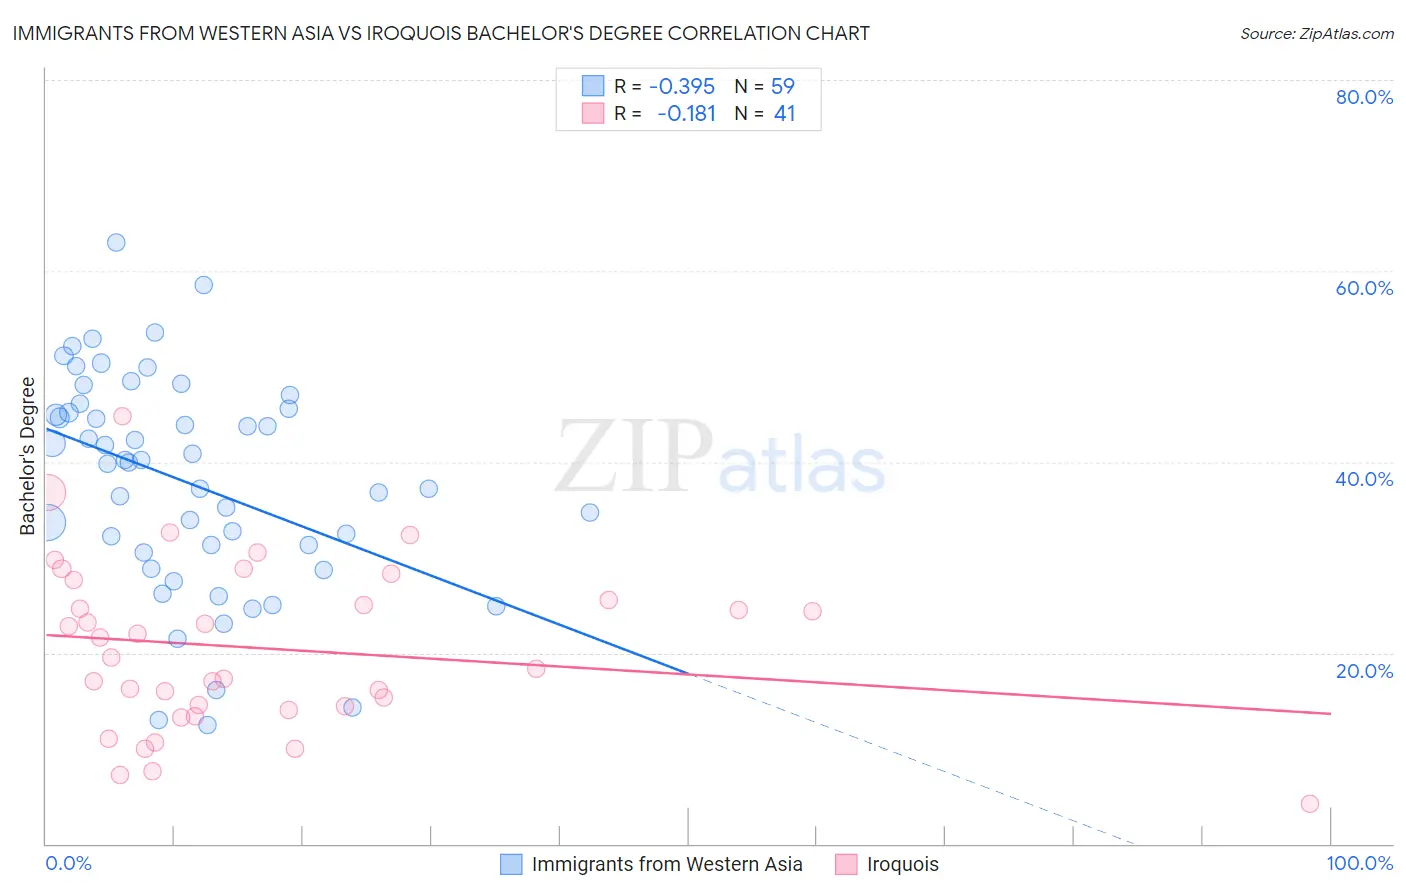
Immigrants from Western Asia vs Iroquois Bachelor's Degree Correlation Chart
The statistical analysis conducted on geographies consisting of 404,403,411 people shows a mild negative correlation between the proportion of Immigrants from Western Asia and percentage of population with at least bachelor's degree education in the United States with a correlation coefficient (R) of -0.395 and weighted average of 42.3%. Similarly, the statistical analysis conducted on geographies consisting of 207,306,427 people shows a poor negative correlation between the proportion of Iroquois and percentage of population with at least bachelor's degree education in the United States with a correlation coefficient (R) of -0.181 and weighted average of 33.2%, a difference of 27.3%.
Bachelor's Degree Correlation Summary
| Measurement | Immigrants from Western Asia | Iroquois |
| Minimum | 12.5% | 4.2% |
| Maximum | 62.9% | 44.8% |
| Range | 50.4% | 40.6% |
| Mean | 37.8% | 20.5% |
| Median | 39.9% | 19.5% |
| Interquartile 25% (IQ1) | 30.5% | 14.2% |
| Interquartile 75% (IQ3) | 45.5% | 26.5% |
| Interquartile Range (IQR) | 15.0% | 12.3% |
| Standard Deviation (Sample) | 11.3% | 8.7% |
| Standard Deviation (Population) | 11.2% | 8.6% |
Similar Demographics by Bachelor's Degree
Demographics Similar to Immigrants from Western Asia by Bachelor's Degree
In terms of bachelor's degree, the demographic groups most similar to Immigrants from Western Asia are Armenian (42.3%, a difference of 0.020%), Lithuanian (42.2%, a difference of 0.030%), Immigrants from Scotland (42.3%, a difference of 0.050%), Immigrants from Hungary (42.3%, a difference of 0.11%), and Immigrants from Brazil (42.2%, a difference of 0.11%).
| Demographics | Rating | Rank | Bachelor's Degree |
| Immigrants | Eastern Europe | 99.4 /100 | #77 | Exceptional 42.5% |
| Immigrants | Ethiopia | 99.4 /100 | #78 | Exceptional 42.5% |
| Immigrants | Lebanon | 99.3 /100 | #79 | Exceptional 42.4% |
| Immigrants | Croatia | 99.2 /100 | #80 | Exceptional 42.3% |
| Immigrants | Hungary | 99.2 /100 | #81 | Exceptional 42.3% |
| Immigrants | Scotland | 99.2 /100 | #82 | Exceptional 42.3% |
| Armenians | 99.2 /100 | #83 | Exceptional 42.3% |
| Immigrants | Western Asia | 99.2 /100 | #84 | Exceptional 42.3% |
| Lithuanians | 99.2 /100 | #85 | Exceptional 42.2% |
| Immigrants | Brazil | 99.2 /100 | #86 | Exceptional 42.2% |
| Carpatho Rusyns | 99.0 /100 | #87 | Exceptional 42.1% |
| Immigrants | Western Europe | 99.0 /100 | #88 | Exceptional 42.0% |
| Greeks | 99.0 /100 | #89 | Exceptional 42.0% |
| Laotians | 98.9 /100 | #90 | Exceptional 42.0% |
| Immigrants | Northern Africa | 98.9 /100 | #91 | Exceptional 41.9% |
Demographics Similar to Iroquois by Bachelor's Degree
In terms of bachelor's degree, the demographic groups most similar to Iroquois are Native Hawaiian (33.2%, a difference of 0.020%), U.S. Virgin Islander (33.2%, a difference of 0.080%), Nicaraguan (33.1%, a difference of 0.19%), Immigrants from Bahamas (33.3%, a difference of 0.28%), and Japanese (33.3%, a difference of 0.36%).
| Demographics | Rating | Rank | Bachelor's Degree |
| Cree | 1.0 /100 | #248 | Tragic 33.6% |
| Immigrants | Liberia | 0.9 /100 | #249 | Tragic 33.5% |
| Indonesians | 0.9 /100 | #250 | Tragic 33.5% |
| Japanese | 0.7 /100 | #251 | Tragic 33.3% |
| Immigrants | Bahamas | 0.7 /100 | #252 | Tragic 33.3% |
| U.S. Virgin Islanders | 0.7 /100 | #253 | Tragic 33.2% |
| Native Hawaiians | 0.7 /100 | #254 | Tragic 33.2% |
| Iroquois | 0.7 /100 | #255 | Tragic 33.2% |
| Nicaraguans | 0.6 /100 | #256 | Tragic 33.1% |
| Spanish Americans | 0.6 /100 | #257 | Tragic 33.1% |
| French American Indians | 0.6 /100 | #258 | Tragic 33.1% |
| Osage | 0.5 /100 | #259 | Tragic 33.0% |
| Malaysians | 0.5 /100 | #260 | Tragic 32.9% |
| Africans | 0.5 /100 | #261 | Tragic 32.9% |
| Immigrants | Jamaica | 0.5 /100 | #262 | Tragic 32.9% |