French Canadian vs Choctaw 9th Grade
COMPARE
French Canadian
Choctaw
9th Grade
9th Grade Comparison
French Canadians
Choctaw
96.3%
9TH GRADE
100.0/ 100
METRIC RATING
26th/ 347
METRIC RANK
95.1%
9TH GRADE
81.9/ 100
METRIC RATING
147th/ 347
METRIC RANK
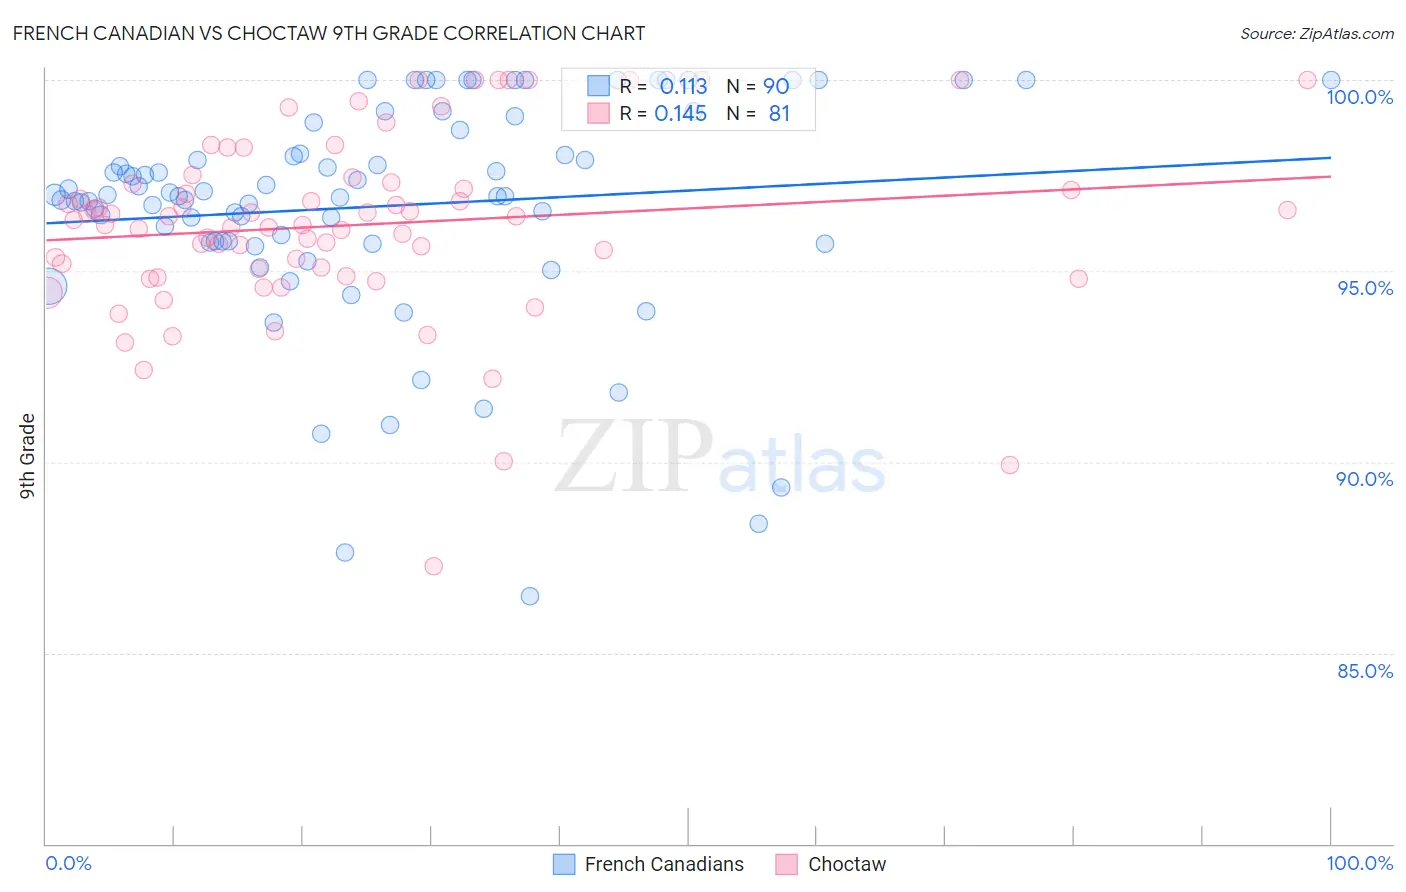
French Canadian vs Choctaw 9th Grade Correlation Chart
The statistical analysis conducted on geographies consisting of 502,679,955 people shows a poor positive correlation between the proportion of French Canadians and percentage of population with at least 9th grade education in the United States with a correlation coefficient (R) of 0.113 and weighted average of 96.3%. Similarly, the statistical analysis conducted on geographies consisting of 269,742,875 people shows a poor positive correlation between the proportion of Choctaw and percentage of population with at least 9th grade education in the United States with a correlation coefficient (R) of 0.145 and weighted average of 95.1%, a difference of 1.2%.
9th Grade Correlation Summary
| Measurement | French Canadian | Choctaw |
| Minimum | 86.5% | 87.3% |
| Maximum | 100.0% | 100.0% |
| Range | 13.5% | 12.7% |
| Mean | 96.7% | 96.2% |
| Median | 97.0% | 96.3% |
| Interquartile 25% (IQ1) | 95.8% | 95.0% |
| Interquartile 75% (IQ3) | 98.7% | 97.3% |
| Interquartile Range (IQR) | 2.9% | 2.3% |
| Standard Deviation (Sample) | 2.9% | 2.4% |
| Standard Deviation (Population) | 2.9% | 2.4% |
Similar Demographics by 9th Grade
Demographics Similar to French Canadians by 9th Grade
In terms of 9th grade, the demographic groups most similar to French Canadians are Scotch-Irish (96.3%, a difference of 0.010%), Eastern European (96.3%, a difference of 0.010%), Chinese (96.3%, a difference of 0.020%), French (96.3%, a difference of 0.030%), and Latvian (96.4%, a difference of 0.040%).
| Demographics | Rating | Rank | 9th Grade |
| Welsh | 100.0 /100 | #19 | Exceptional 96.4% |
| Italians | 100.0 /100 | #20 | Exceptional 96.4% |
| Alaskan Athabascans | 100.0 /100 | #21 | Exceptional 96.4% |
| Europeans | 100.0 /100 | #22 | Exceptional 96.4% |
| Czechs | 100.0 /100 | #23 | Exceptional 96.4% |
| Latvians | 100.0 /100 | #24 | Exceptional 96.4% |
| French | 100.0 /100 | #25 | Exceptional 96.3% |
| French Canadians | 100.0 /100 | #26 | Exceptional 96.3% |
| Scotch-Irish | 100.0 /100 | #27 | Exceptional 96.3% |
| Eastern Europeans | 100.0 /100 | #28 | Exceptional 96.3% |
| Chinese | 100.0 /100 | #29 | Exceptional 96.3% |
| Maltese | 100.0 /100 | #30 | Exceptional 96.3% |
| British | 100.0 /100 | #31 | Exceptional 96.3% |
| Belgians | 100.0 /100 | #32 | Exceptional 96.3% |
| Luxembourgers | 100.0 /100 | #33 | Exceptional 96.3% |
Demographics Similar to Choctaw by 9th Grade
In terms of 9th grade, the demographic groups most similar to Choctaw are Pueblo (95.1%, a difference of 0.0%), Immigrants from Sri Lanka (95.1%, a difference of 0.0%), Immigrants from Jordan (95.1%, a difference of 0.010%), Yup'ik (95.2%, a difference of 0.020%), and Spanish (95.2%, a difference of 0.030%).
| Demographics | Rating | Rank | 9th Grade |
| Immigrants | Taiwan | 85.3 /100 | #140 | Excellent 95.2% |
| Immigrants | Bosnia and Herzegovina | 85.2 /100 | #141 | Excellent 95.2% |
| Immigrants | Greece | 84.6 /100 | #142 | Excellent 95.2% |
| Spanish | 84.4 /100 | #143 | Excellent 95.2% |
| Yup'ik | 83.3 /100 | #144 | Excellent 95.2% |
| Pueblo | 82.2 /100 | #145 | Excellent 95.1% |
| Immigrants | Sri Lanka | 82.1 /100 | #146 | Excellent 95.1% |
| Choctaw | 81.9 /100 | #147 | Excellent 95.1% |
| Immigrants | Jordan | 81.2 /100 | #148 | Excellent 95.1% |
| Immigrants | Korea | 79.6 /100 | #149 | Good 95.1% |
| Kenyans | 79.1 /100 | #150 | Good 95.1% |
| Cajuns | 77.3 /100 | #151 | Good 95.1% |
| Ugandans | 77.0 /100 | #152 | Good 95.1% |
| Albanians | 76.1 /100 | #153 | Good 95.1% |
| Arabs | 74.9 /100 | #154 | Good 95.1% |