Immigrants from West Indies vs Salvadoran 4th Grade
COMPARE
Immigrants from West Indies
Salvadoran
4th Grade
4th Grade Comparison
Immigrants from West Indies
Salvadorans
96.7%
4TH GRADE
0.0/ 100
METRIC RATING
289th/ 347
METRIC RANK
95.0%
4TH GRADE
0.0/ 100
METRIC RATING
345th/ 347
METRIC RANK
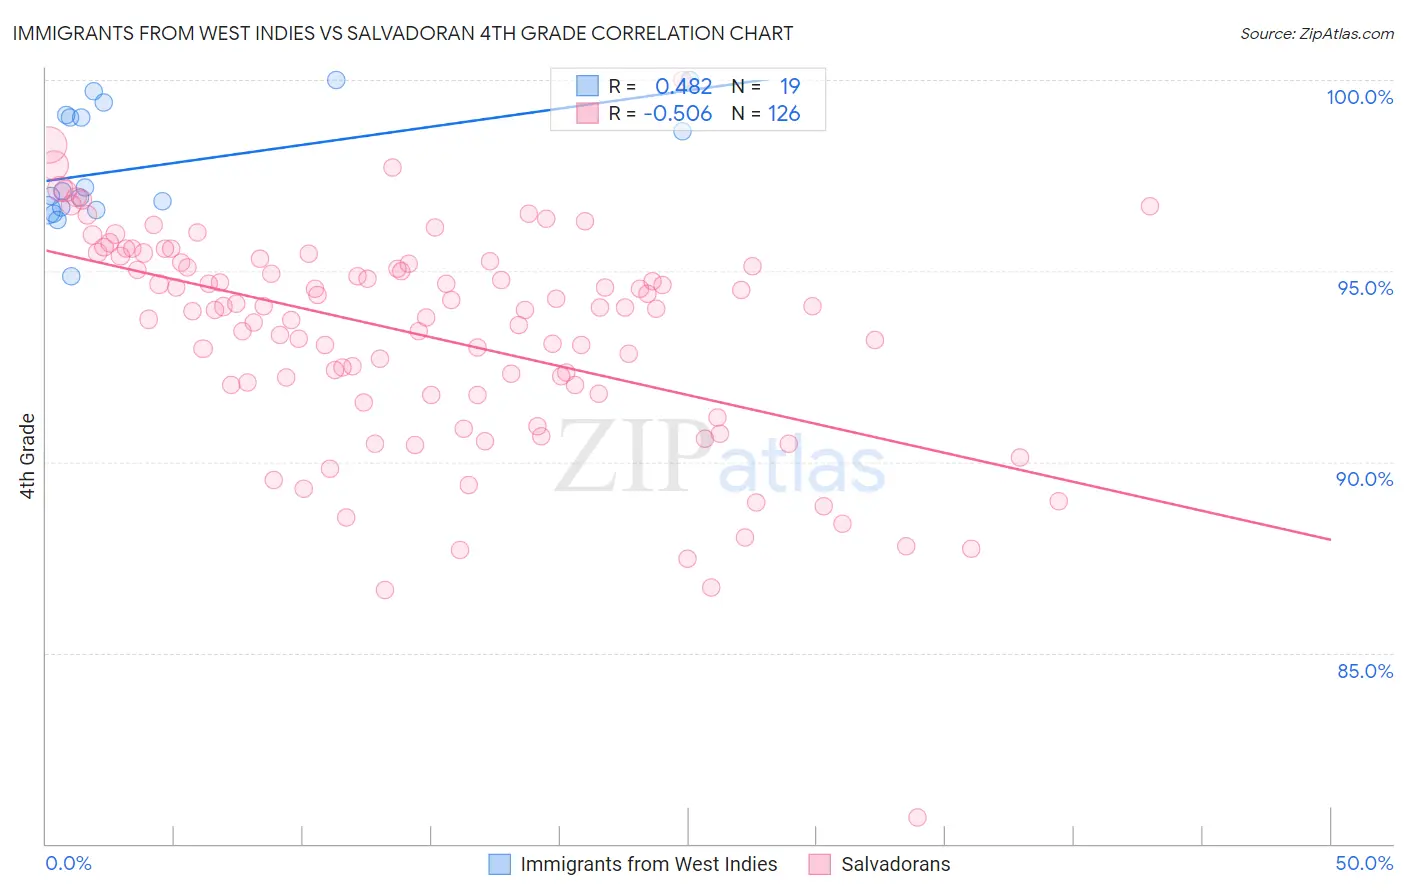
Immigrants from West Indies vs Salvadoran 4th Grade Correlation Chart
The statistical analysis conducted on geographies consisting of 72,457,514 people shows a moderate positive correlation between the proportion of Immigrants from West Indies and percentage of population with at least 4th grade education in the United States with a correlation coefficient (R) of 0.482 and weighted average of 96.7%. Similarly, the statistical analysis conducted on geographies consisting of 399,033,726 people shows a substantial negative correlation between the proportion of Salvadorans and percentage of population with at least 4th grade education in the United States with a correlation coefficient (R) of -0.506 and weighted average of 95.0%, a difference of 1.8%.
4th Grade Correlation Summary
| Measurement | Immigrants from West Indies | Salvadoran |
| Minimum | 94.9% | 80.7% |
| Maximum | 100.0% | 100.0% |
| Range | 5.1% | 19.3% |
| Mean | 97.8% | 93.3% |
| Median | 97.1% | 94.0% |
| Interquartile 25% (IQ1) | 96.6% | 91.8% |
| Interquartile 75% (IQ3) | 99.1% | 95.2% |
| Interquartile Range (IQR) | 2.5% | 3.4% |
| Standard Deviation (Sample) | 1.5% | 2.9% |
| Standard Deviation (Population) | 1.5% | 2.9% |
Similar Demographics by 4th Grade
Demographics Similar to Immigrants from West Indies by 4th Grade
In terms of 4th grade, the demographic groups most similar to Immigrants from West Indies are British West Indian (96.7%, a difference of 0.010%), Houma (96.8%, a difference of 0.020%), Immigrants from Afghanistan (96.8%, a difference of 0.020%), Immigrants from Grenada (96.7%, a difference of 0.040%), and Malaysian (96.7%, a difference of 0.050%).
| Demographics | Rating | Rank | 4th Grade |
| Immigrants | Trinidad and Tobago | 0.1 /100 | #282 | Tragic 96.8% |
| Immigrants | Philippines | 0.1 /100 | #283 | Tragic 96.8% |
| Immigrants | St. Vincent and the Grenadines | 0.1 /100 | #284 | Tragic 96.8% |
| Immigrants | Barbados | 0.0 /100 | #285 | Tragic 96.8% |
| Immigrants | Thailand | 0.0 /100 | #286 | Tragic 96.8% |
| Houma | 0.0 /100 | #287 | Tragic 96.8% |
| Immigrants | Afghanistan | 0.0 /100 | #288 | Tragic 96.8% |
| Immigrants | West Indies | 0.0 /100 | #289 | Tragic 96.7% |
| British West Indians | 0.0 /100 | #290 | Tragic 96.7% |
| Immigrants | Grenada | 0.0 /100 | #291 | Tragic 96.7% |
| Malaysians | 0.0 /100 | #292 | Tragic 96.7% |
| Puerto Ricans | 0.0 /100 | #293 | Tragic 96.7% |
| Immigrants | Eritrea | 0.0 /100 | #294 | Tragic 96.7% |
| Immigrants | Portugal | 0.0 /100 | #295 | Tragic 96.6% |
| Somalis | 0.0 /100 | #296 | Tragic 96.6% |
Demographics Similar to Salvadorans by 4th Grade
In terms of 4th grade, the demographic groups most similar to Salvadorans are Immigrants from Mexico (95.1%, a difference of 0.010%), Immigrants from Guatemala (95.1%, a difference of 0.040%), Immigrants from Central America (95.1%, a difference of 0.070%), Immigrants from Yemen (95.2%, a difference of 0.15%), and Yakama (95.2%, a difference of 0.16%).
| Demographics | Rating | Rank | 4th Grade |
| Immigrants | Dominican Republic | 0.0 /100 | #333 | Tragic 95.7% |
| Immigrants | Cabo Verde | 0.0 /100 | #334 | Tragic 95.7% |
| Immigrants | Latin America | 0.0 /100 | #335 | Tragic 95.7% |
| Mexicans | 0.0 /100 | #336 | Tragic 95.6% |
| Central Americans | 0.0 /100 | #337 | Tragic 95.5% |
| Nepalese | 0.0 /100 | #338 | Tragic 95.5% |
| Guatemalans | 0.0 /100 | #339 | Tragic 95.3% |
| Yakama | 0.0 /100 | #340 | Tragic 95.2% |
| Immigrants | Yemen | 0.0 /100 | #341 | Tragic 95.2% |
| Immigrants | Central America | 0.0 /100 | #342 | Tragic 95.1% |
| Immigrants | Guatemala | 0.0 /100 | #343 | Tragic 95.1% |
| Immigrants | Mexico | 0.0 /100 | #344 | Tragic 95.1% |
| Salvadorans | 0.0 /100 | #345 | Tragic 95.0% |
| Immigrants | El Salvador | 0.0 /100 | #346 | Tragic 94.8% |
| Spanish American Indians | 0.0 /100 | #347 | Tragic 94.6% |