Serbian vs Salvadoran 4th Grade
COMPARE
Serbian
Salvadoran
4th Grade
4th Grade Comparison
Serbians
Salvadorans
98.1%
4TH GRADE
99.7/ 100
METRIC RATING
62nd/ 347
METRIC RANK
95.0%
4TH GRADE
0.0/ 100
METRIC RATING
345th/ 347
METRIC RANK
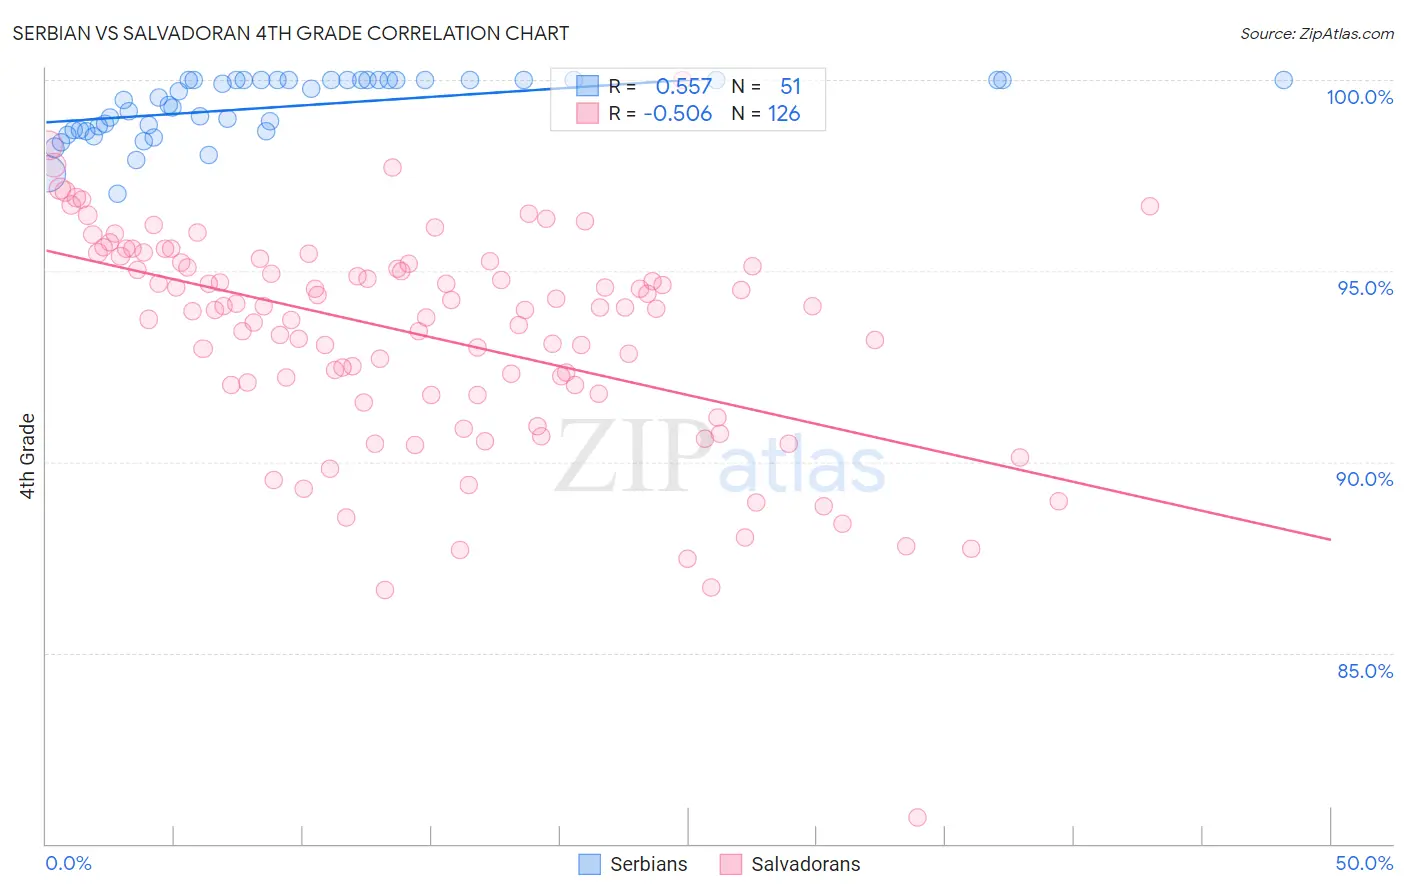
Serbian vs Salvadoran 4th Grade Correlation Chart
The statistical analysis conducted on geographies consisting of 267,642,942 people shows a substantial positive correlation between the proportion of Serbians and percentage of population with at least 4th grade education in the United States with a correlation coefficient (R) of 0.557 and weighted average of 98.1%. Similarly, the statistical analysis conducted on geographies consisting of 399,033,726 people shows a substantial negative correlation between the proportion of Salvadorans and percentage of population with at least 4th grade education in the United States with a correlation coefficient (R) of -0.506 and weighted average of 95.0%, a difference of 3.2%.
4th Grade Correlation Summary
| Measurement | Serbian | Salvadoran |
| Minimum | 97.0% | 80.7% |
| Maximum | 100.0% | 100.0% |
| Range | 3.0% | 19.3% |
| Mean | 99.3% | 93.3% |
| Median | 99.5% | 94.0% |
| Interquartile 25% (IQ1) | 98.7% | 91.8% |
| Interquartile 75% (IQ3) | 100.0% | 95.2% |
| Interquartile Range (IQR) | 1.3% | 3.4% |
| Standard Deviation (Sample) | 0.78% | 2.9% |
| Standard Deviation (Population) | 0.78% | 2.9% |
Similar Demographics by 4th Grade
Demographics Similar to Serbians by 4th Grade
In terms of 4th grade, the demographic groups most similar to Serbians are Immigrants from North America (98.1%, a difference of 0.0%), Immigrants from Canada (98.1%, a difference of 0.010%), Russian (98.0%, a difference of 0.010%), Cajun (98.0%, a difference of 0.010%), and American (98.1%, a difference of 0.020%).
| Demographics | Rating | Rank | 4th Grade |
| Whites/Caucasians | 99.8 /100 | #55 | Exceptional 98.1% |
| Greeks | 99.8 /100 | #56 | Exceptional 98.1% |
| Austrians | 99.8 /100 | #57 | Exceptional 98.1% |
| Creek | 99.8 /100 | #58 | Exceptional 98.1% |
| Americans | 99.8 /100 | #59 | Exceptional 98.1% |
| Immigrants | Canada | 99.7 /100 | #60 | Exceptional 98.1% |
| Immigrants | North America | 99.7 /100 | #61 | Exceptional 98.1% |
| Serbians | 99.7 /100 | #62 | Exceptional 98.1% |
| Russians | 99.7 /100 | #63 | Exceptional 98.0% |
| Cajuns | 99.7 /100 | #64 | Exceptional 98.0% |
| Immigrants | Northern Europe | 99.6 /100 | #65 | Exceptional 98.0% |
| Canadians | 99.6 /100 | #66 | Exceptional 98.0% |
| New Zealanders | 99.6 /100 | #67 | Exceptional 98.0% |
| Kiowa | 99.6 /100 | #68 | Exceptional 98.0% |
| Pueblo | 99.6 /100 | #69 | Exceptional 98.0% |
Demographics Similar to Salvadorans by 4th Grade
In terms of 4th grade, the demographic groups most similar to Salvadorans are Immigrants from Mexico (95.1%, a difference of 0.010%), Immigrants from Guatemala (95.1%, a difference of 0.040%), Immigrants from Central America (95.1%, a difference of 0.070%), Immigrants from Yemen (95.2%, a difference of 0.15%), and Yakama (95.2%, a difference of 0.16%).
| Demographics | Rating | Rank | 4th Grade |
| Immigrants | Dominican Republic | 0.0 /100 | #333 | Tragic 95.7% |
| Immigrants | Cabo Verde | 0.0 /100 | #334 | Tragic 95.7% |
| Immigrants | Latin America | 0.0 /100 | #335 | Tragic 95.7% |
| Mexicans | 0.0 /100 | #336 | Tragic 95.6% |
| Central Americans | 0.0 /100 | #337 | Tragic 95.5% |
| Nepalese | 0.0 /100 | #338 | Tragic 95.5% |
| Guatemalans | 0.0 /100 | #339 | Tragic 95.3% |
| Yakama | 0.0 /100 | #340 | Tragic 95.2% |
| Immigrants | Yemen | 0.0 /100 | #341 | Tragic 95.2% |
| Immigrants | Central America | 0.0 /100 | #342 | Tragic 95.1% |
| Immigrants | Guatemala | 0.0 /100 | #343 | Tragic 95.1% |
| Immigrants | Mexico | 0.0 /100 | #344 | Tragic 95.1% |
| Salvadorans | 0.0 /100 | #345 | Tragic 95.0% |
| Immigrants | El Salvador | 0.0 /100 | #346 | Tragic 94.8% |
| Spanish American Indians | 0.0 /100 | #347 | Tragic 94.6% |