Immigrants from West Indies vs Immigrants from Northern Africa Associate's Degree
COMPARE
Immigrants from West Indies
Immigrants from Northern Africa
Associate's Degree
Associate's Degree Comparison
Immigrants from West Indies
Immigrants from Northern Africa
42.4%
ASSOCIATE'S DEGREE
1.0/ 100
METRIC RATING
242nd/ 347
METRIC RANK
49.7%
ASSOCIATE'S DEGREE
97.9/ 100
METRIC RATING
98th/ 347
METRIC RANK
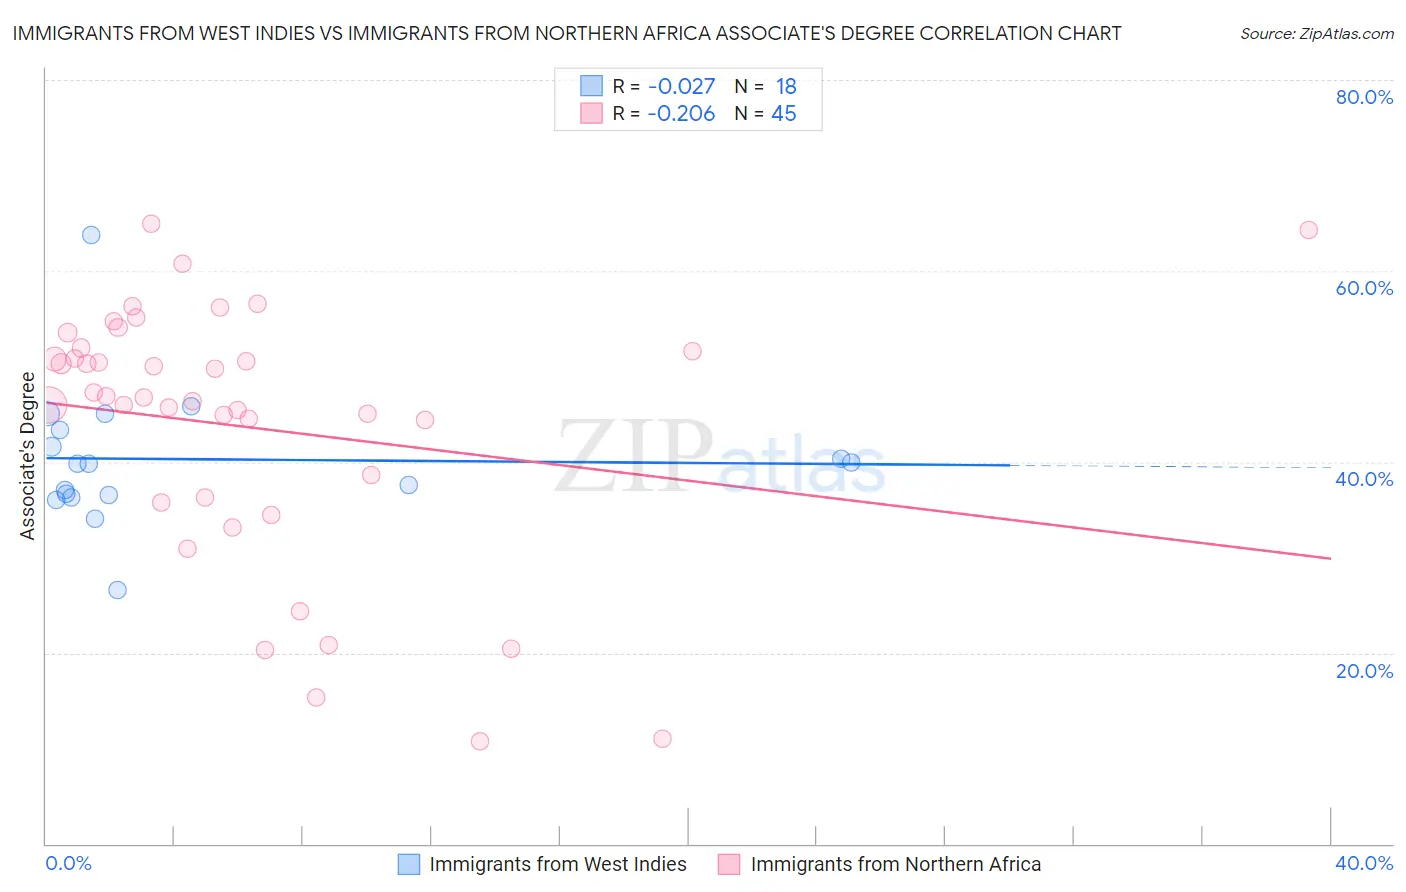
Immigrants from West Indies vs Immigrants from Northern Africa Associate's Degree Correlation Chart
The statistical analysis conducted on geographies consisting of 72,420,477 people shows no correlation between the proportion of Immigrants from West Indies and percentage of population with at least associate's degree education in the United States with a correlation coefficient (R) of -0.027 and weighted average of 42.4%. Similarly, the statistical analysis conducted on geographies consisting of 321,197,052 people shows a weak negative correlation between the proportion of Immigrants from Northern Africa and percentage of population with at least associate's degree education in the United States with a correlation coefficient (R) of -0.206 and weighted average of 49.7%, a difference of 17.2%.
Associate's Degree Correlation Summary
| Measurement | Immigrants from West Indies | Immigrants from Northern Africa |
| Minimum | 26.6% | 10.8% |
| Maximum | 63.8% | 65.0% |
| Range | 37.2% | 54.2% |
| Mean | 40.3% | 43.6% |
| Median | 39.8% | 46.7% |
| Interquartile 25% (IQ1) | 36.5% | 36.0% |
| Interquartile 75% (IQ3) | 43.4% | 51.8% |
| Interquartile Range (IQR) | 6.9% | 15.8% |
| Standard Deviation (Sample) | 7.5% | 13.6% |
| Standard Deviation (Population) | 7.2% | 13.4% |
Similar Demographics by Associate's Degree
Demographics Similar to Immigrants from West Indies by Associate's Degree
In terms of associate's degree, the demographic groups most similar to Immigrants from West Indies are British West Indian (42.4%, a difference of 0.010%), Guyanese (42.3%, a difference of 0.11%), Immigrants from Liberia (42.3%, a difference of 0.25%), Immigrants from Cambodia (42.3%, a difference of 0.27%), and Delaware (42.3%, a difference of 0.30%).
| Demographics | Rating | Rank | Associate's Degree |
| Ecuadorians | 2.0 /100 | #235 | Tragic 43.0% |
| Immigrants | St. Vincent and the Grenadines | 1.9 /100 | #236 | Tragic 42.9% |
| Immigrants | Nonimmigrants | 1.9 /100 | #237 | Tragic 42.9% |
| Iroquois | 1.7 /100 | #238 | Tragic 42.8% |
| Immigrants | Grenada | 1.3 /100 | #239 | Tragic 42.6% |
| Cree | 1.2 /100 | #240 | Tragic 42.5% |
| British West Indians | 1.0 /100 | #241 | Tragic 42.4% |
| Immigrants | West Indies | 1.0 /100 | #242 | Tragic 42.4% |
| Guyanese | 1.0 /100 | #243 | Tragic 42.3% |
| Immigrants | Liberia | 0.9 /100 | #244 | Tragic 42.3% |
| Immigrants | Cambodia | 0.9 /100 | #245 | Tragic 42.3% |
| Delaware | 0.9 /100 | #246 | Tragic 42.3% |
| Immigrants | Fiji | 0.8 /100 | #247 | Tragic 42.2% |
| Immigrants | Ecuador | 0.8 /100 | #248 | Tragic 42.2% |
| Jamaicans | 0.7 /100 | #249 | Tragic 42.1% |
Demographics Similar to Immigrants from Northern Africa by Associate's Degree
In terms of associate's degree, the demographic groups most similar to Immigrants from Northern Africa are Macedonian (49.6%, a difference of 0.070%), Romanian (49.7%, a difference of 0.090%), Immigrants from Ukraine (49.7%, a difference of 0.090%), Immigrants from England (49.7%, a difference of 0.11%), and Immigrants from Nepal (49.5%, a difference of 0.28%).
| Demographics | Rating | Rank | Associate's Degree |
| Immigrants | Western Asia | 98.7 /100 | #91 | Exceptional 50.1% |
| Immigrants | North America | 98.7 /100 | #92 | Exceptional 50.1% |
| Immigrants | Brazil | 98.5 /100 | #93 | Exceptional 50.0% |
| Laotians | 98.4 /100 | #94 | Exceptional 49.9% |
| Immigrants | England | 98.0 /100 | #95 | Exceptional 49.7% |
| Romanians | 98.0 /100 | #96 | Exceptional 49.7% |
| Immigrants | Ukraine | 98.0 /100 | #97 | Exceptional 49.7% |
| Immigrants | Northern Africa | 97.9 /100 | #98 | Exceptional 49.7% |
| Macedonians | 97.8 /100 | #99 | Exceptional 49.6% |
| Immigrants | Nepal | 97.5 /100 | #100 | Exceptional 49.5% |
| Northern Europeans | 97.3 /100 | #101 | Exceptional 49.5% |
| Chileans | 97.3 /100 | #102 | Exceptional 49.4% |
| Ukrainians | 97.1 /100 | #103 | Exceptional 49.4% |
| Venezuelans | 97.0 /100 | #104 | Exceptional 49.4% |
| Croatians | 96.8 /100 | #105 | Exceptional 49.3% |