Immigrants from Vietnam vs Yup'ik 7th Grade
COMPARE
Immigrants from Vietnam
Yup'ik
7th Grade
7th Grade Comparison
Immigrants from Vietnam
Yup'ik
93.9%
7TH GRADE
0.0/ 100
METRIC RATING
316th/ 347
METRIC RANK
97.4%
7TH GRADE
100.0/ 100
METRIC RATING
20th/ 347
METRIC RANK
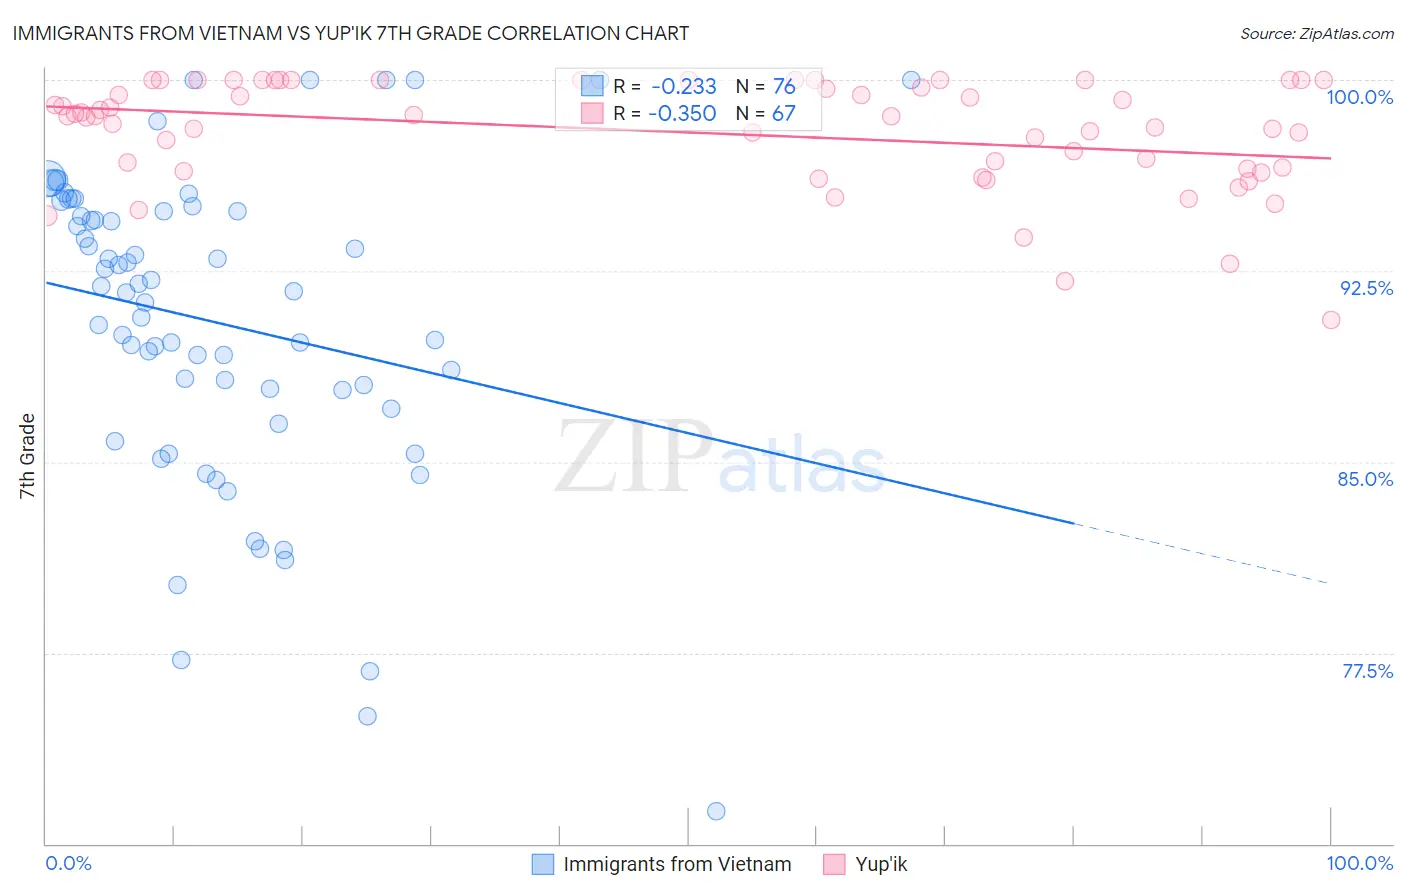
Immigrants from Vietnam vs Yup'ik 7th Grade Correlation Chart
The statistical analysis conducted on geographies consisting of 404,844,322 people shows a weak negative correlation between the proportion of Immigrants from Vietnam and percentage of population with at least 7th grade education in the United States with a correlation coefficient (R) of -0.233 and weighted average of 93.9%. Similarly, the statistical analysis conducted on geographies consisting of 39,963,824 people shows a mild negative correlation between the proportion of Yup'ik and percentage of population with at least 7th grade education in the United States with a correlation coefficient (R) of -0.350 and weighted average of 97.4%, a difference of 3.8%.
7th Grade Correlation Summary
| Measurement | Immigrants from Vietnam | Yup'ik |
| Minimum | 71.3% | 90.6% |
| Maximum | 100.0% | 100.0% |
| Range | 28.7% | 9.4% |
| Mean | 90.5% | 97.9% |
| Median | 91.7% | 98.6% |
| Interquartile 25% (IQ1) | 87.5% | 96.5% |
| Interquartile 75% (IQ3) | 94.9% | 100.0% |
| Interquartile Range (IQR) | 7.4% | 3.5% |
| Standard Deviation (Sample) | 6.1% | 2.1% |
| Standard Deviation (Population) | 6.1% | 2.1% |
Similar Demographics by 7th Grade
Demographics Similar to Immigrants from Vietnam by 7th Grade
In terms of 7th grade, the demographic groups most similar to Immigrants from Vietnam are Vietnamese (93.9%, a difference of 0.030%), Japanese (94.0%, a difference of 0.080%), Immigrants from Cuba (93.8%, a difference of 0.090%), Immigrants (94.0%, a difference of 0.11%), and Immigrants from Bangladesh (94.0%, a difference of 0.11%).
| Demographics | Rating | Rank | 7th Grade |
| Ecuadorians | 0.0 /100 | #309 | Tragic 94.0% |
| Immigrants | Caribbean | 0.0 /100 | #310 | Tragic 94.0% |
| Puerto Ricans | 0.0 /100 | #311 | Tragic 94.0% |
| Immigrants | Immigrants | 0.0 /100 | #312 | Tragic 94.0% |
| Immigrants | Bangladesh | 0.0 /100 | #313 | Tragic 94.0% |
| Japanese | 0.0 /100 | #314 | Tragic 94.0% |
| Vietnamese | 0.0 /100 | #315 | Tragic 93.9% |
| Immigrants | Vietnam | 0.0 /100 | #316 | Tragic 93.9% |
| Immigrants | Cuba | 0.0 /100 | #317 | Tragic 93.8% |
| Immigrants | Ecuador | 0.0 /100 | #318 | Tragic 93.7% |
| Immigrants | Cambodia | 0.0 /100 | #319 | Tragic 93.7% |
| Immigrants | Fiji | 0.0 /100 | #320 | Tragic 93.5% |
| Belizeans | 0.0 /100 | #321 | Tragic 93.5% |
| Nicaraguans | 0.0 /100 | #322 | Tragic 93.5% |
| Immigrants | Belize | 0.0 /100 | #323 | Tragic 93.4% |
Demographics Similar to Yup'ik by 7th Grade
In terms of 7th grade, the demographic groups most similar to Yup'ik are Inupiat (97.4%, a difference of 0.010%), French Canadian (97.4%, a difference of 0.020%), Croatian (97.4%, a difference of 0.030%), Lithuanian (97.5%, a difference of 0.040%), and Tlingit-Haida (97.5%, a difference of 0.050%).
| Demographics | Rating | Rank | 7th Grade |
| Swedes | 100.0 /100 | #13 | Exceptional 97.6% |
| Pennsylvania Germans | 100.0 /100 | #14 | Exceptional 97.6% |
| English | 100.0 /100 | #15 | Exceptional 97.6% |
| Irish | 100.0 /100 | #16 | Exceptional 97.5% |
| Scottish | 100.0 /100 | #17 | Exceptional 97.5% |
| Tlingit-Haida | 100.0 /100 | #18 | Exceptional 97.5% |
| Lithuanians | 100.0 /100 | #19 | Exceptional 97.5% |
| Yup'ik | 100.0 /100 | #20 | Exceptional 97.4% |
| Inupiat | 100.0 /100 | #21 | Exceptional 97.4% |
| French Canadians | 100.0 /100 | #22 | Exceptional 97.4% |
| Croatians | 100.0 /100 | #23 | Exceptional 97.4% |
| Welsh | 100.0 /100 | #24 | Exceptional 97.4% |
| French | 100.0 /100 | #25 | Exceptional 97.4% |
| Scotch-Irish | 100.0 /100 | #26 | Exceptional 97.4% |
| Danes | 100.0 /100 | #27 | Exceptional 97.4% |