Immigrants from Vietnam vs Italian 7th Grade
COMPARE
Immigrants from Vietnam
Italian
7th Grade
7th Grade Comparison
Immigrants from Vietnam
Italians
93.9%
7TH GRADE
0.0/ 100
METRIC RATING
316th/ 347
METRIC RANK
97.3%
7TH GRADE
100.0/ 100
METRIC RATING
32nd/ 347
METRIC RANK
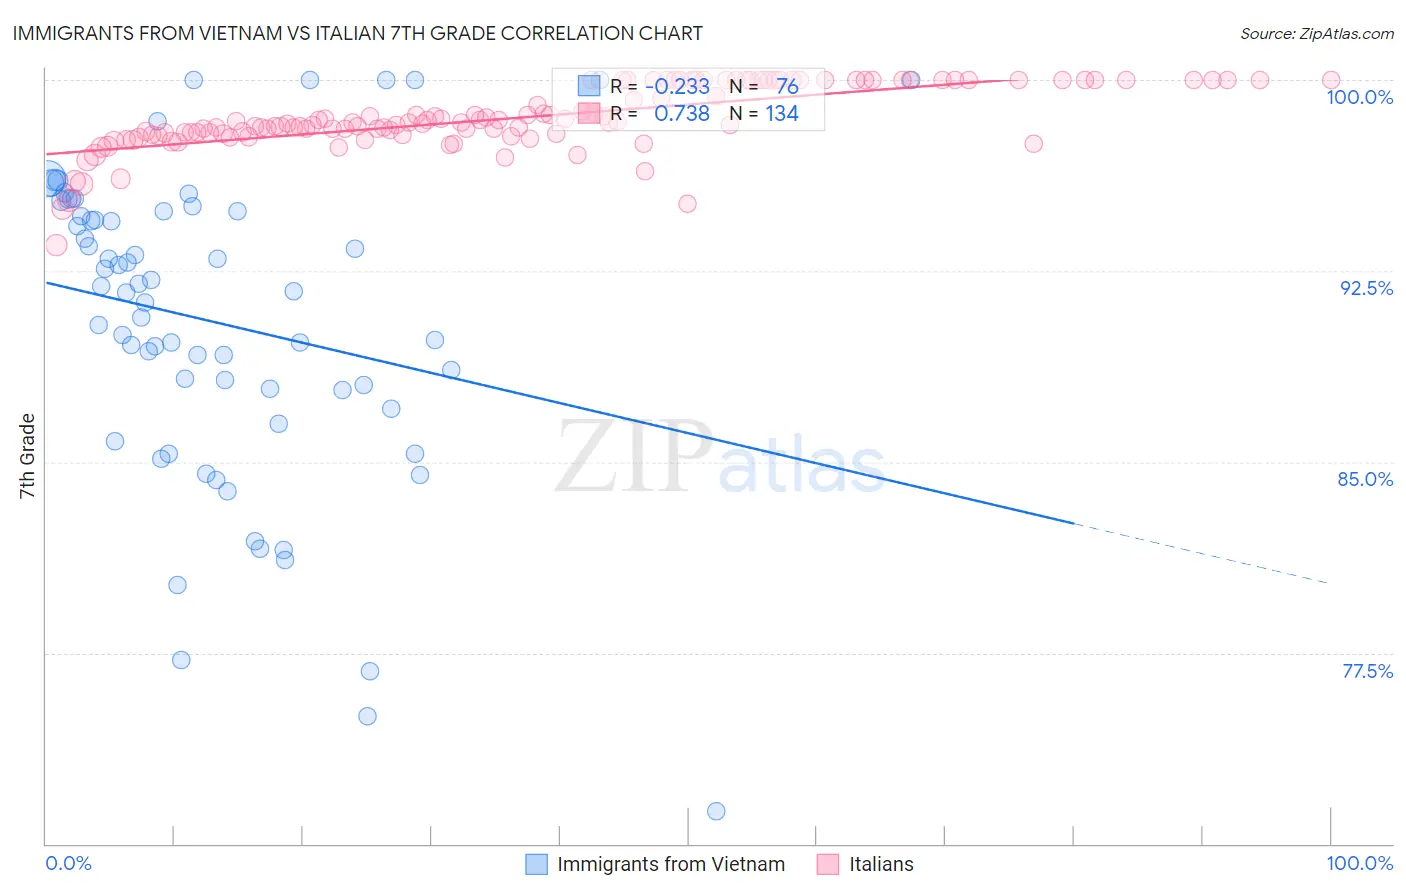
Immigrants from Vietnam vs Italian 7th Grade Correlation Chart
The statistical analysis conducted on geographies consisting of 404,844,322 people shows a weak negative correlation between the proportion of Immigrants from Vietnam and percentage of population with at least 7th grade education in the United States with a correlation coefficient (R) of -0.233 and weighted average of 93.9%. Similarly, the statistical analysis conducted on geographies consisting of 546,284,153 people shows a strong positive correlation between the proportion of Italians and percentage of population with at least 7th grade education in the United States with a correlation coefficient (R) of 0.738 and weighted average of 97.3%, a difference of 3.7%.
7th Grade Correlation Summary
| Measurement | Immigrants from Vietnam | Italian |
| Minimum | 71.3% | 93.5% |
| Maximum | 100.0% | 100.0% |
| Range | 28.7% | 6.5% |
| Mean | 90.5% | 98.5% |
| Median | 91.7% | 98.3% |
| Interquartile 25% (IQ1) | 87.5% | 97.9% |
| Interquartile 75% (IQ3) | 94.9% | 100.0% |
| Interquartile Range (IQR) | 7.4% | 2.1% |
| Standard Deviation (Sample) | 6.1% | 1.2% |
| Standard Deviation (Population) | 6.1% | 1.2% |
Similar Demographics by 7th Grade
Demographics Similar to Immigrants from Vietnam by 7th Grade
In terms of 7th grade, the demographic groups most similar to Immigrants from Vietnam are Vietnamese (93.9%, a difference of 0.030%), Japanese (94.0%, a difference of 0.080%), Immigrants from Cuba (93.8%, a difference of 0.090%), Immigrants (94.0%, a difference of 0.11%), and Immigrants from Bangladesh (94.0%, a difference of 0.11%).
| Demographics | Rating | Rank | 7th Grade |
| Ecuadorians | 0.0 /100 | #309 | Tragic 94.0% |
| Immigrants | Caribbean | 0.0 /100 | #310 | Tragic 94.0% |
| Puerto Ricans | 0.0 /100 | #311 | Tragic 94.0% |
| Immigrants | Immigrants | 0.0 /100 | #312 | Tragic 94.0% |
| Immigrants | Bangladesh | 0.0 /100 | #313 | Tragic 94.0% |
| Japanese | 0.0 /100 | #314 | Tragic 94.0% |
| Vietnamese | 0.0 /100 | #315 | Tragic 93.9% |
| Immigrants | Vietnam | 0.0 /100 | #316 | Tragic 93.9% |
| Immigrants | Cuba | 0.0 /100 | #317 | Tragic 93.8% |
| Immigrants | Ecuador | 0.0 /100 | #318 | Tragic 93.7% |
| Immigrants | Cambodia | 0.0 /100 | #319 | Tragic 93.7% |
| Immigrants | Fiji | 0.0 /100 | #320 | Tragic 93.5% |
| Belizeans | 0.0 /100 | #321 | Tragic 93.5% |
| Nicaraguans | 0.0 /100 | #322 | Tragic 93.5% |
| Immigrants | Belize | 0.0 /100 | #323 | Tragic 93.4% |
Demographics Similar to Italians by 7th Grade
In terms of 7th grade, the demographic groups most similar to Italians are European (97.3%, a difference of 0.0%), Chippewa (97.3%, a difference of 0.010%), Czech (97.4%, a difference of 0.020%), Sioux (97.4%, a difference of 0.030%), and Scandinavian (97.4%, a difference of 0.030%).
| Demographics | Rating | Rank | 7th Grade |
| French | 100.0 /100 | #25 | Exceptional 97.4% |
| Scotch-Irish | 100.0 /100 | #26 | Exceptional 97.4% |
| Danes | 100.0 /100 | #27 | Exceptional 97.4% |
| Sioux | 100.0 /100 | #28 | Exceptional 97.4% |
| Scandinavians | 100.0 /100 | #29 | Exceptional 97.4% |
| Czechs | 100.0 /100 | #30 | Exceptional 97.4% |
| Europeans | 100.0 /100 | #31 | Exceptional 97.3% |
| Italians | 100.0 /100 | #32 | Exceptional 97.3% |
| Chippewa | 100.0 /100 | #33 | Exceptional 97.3% |
| Alaska Natives | 100.0 /100 | #34 | Exceptional 97.3% |
| Swiss | 100.0 /100 | #35 | Exceptional 97.3% |
| Hungarians | 100.0 /100 | #36 | Exceptional 97.2% |
| British | 100.0 /100 | #37 | Exceptional 97.2% |
| Belgians | 100.0 /100 | #38 | Exceptional 97.2% |
| Latvians | 100.0 /100 | #39 | Exceptional 97.2% |