Immigrants from Morocco vs Yup'ik 7th Grade
COMPARE
Immigrants from Morocco
Yup'ik
7th Grade
7th Grade Comparison
Immigrants from Morocco
Yup'ik
95.8%
7TH GRADE
12.6/ 100
METRIC RATING
213th/ 347
METRIC RANK
97.4%
7TH GRADE
100.0/ 100
METRIC RATING
20th/ 347
METRIC RANK
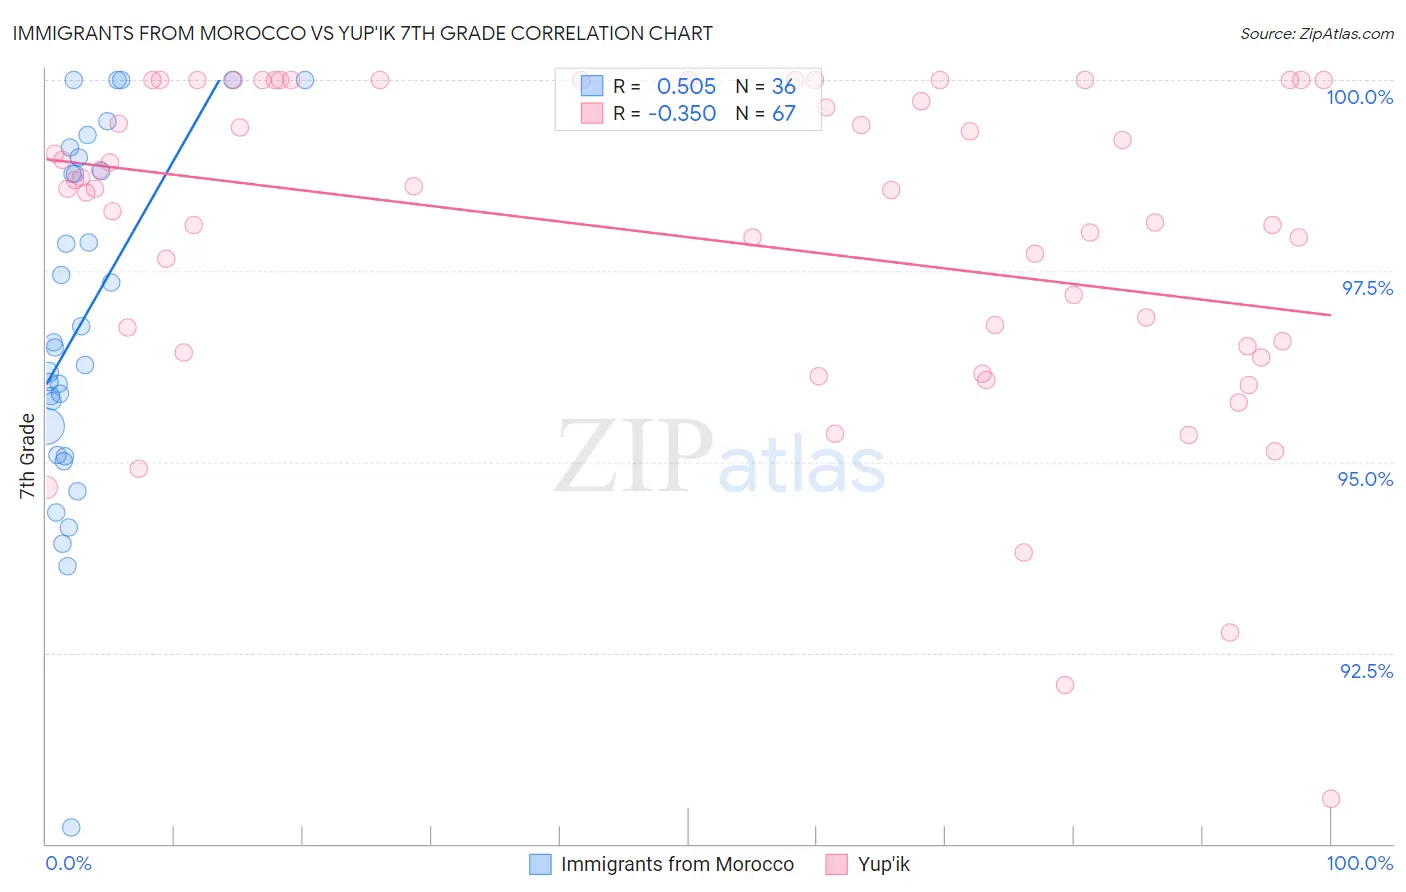
Immigrants from Morocco vs Yup'ik 7th Grade Correlation Chart
The statistical analysis conducted on geographies consisting of 178,910,634 people shows a substantial positive correlation between the proportion of Immigrants from Morocco and percentage of population with at least 7th grade education in the United States with a correlation coefficient (R) of 0.505 and weighted average of 95.8%. Similarly, the statistical analysis conducted on geographies consisting of 39,963,824 people shows a mild negative correlation between the proportion of Yup'ik and percentage of population with at least 7th grade education in the United States with a correlation coefficient (R) of -0.350 and weighted average of 97.4%, a difference of 1.8%.
7th Grade Correlation Summary
| Measurement | Immigrants from Morocco | Yup'ik |
| Minimum | 90.2% | 90.6% |
| Maximum | 100.0% | 100.0% |
| Range | 9.8% | 9.4% |
| Mean | 96.9% | 97.9% |
| Median | 96.5% | 98.6% |
| Interquartile 25% (IQ1) | 95.3% | 96.5% |
| Interquartile 75% (IQ3) | 98.9% | 100.0% |
| Interquartile Range (IQR) | 3.6% | 3.5% |
| Standard Deviation (Sample) | 2.3% | 2.1% |
| Standard Deviation (Population) | 2.3% | 2.1% |
Similar Demographics by 7th Grade
Demographics Similar to Immigrants from Morocco by 7th Grade
In terms of 7th grade, the demographic groups most similar to Immigrants from Morocco are Immigrants from Lebanon (95.8%, a difference of 0.0%), Portuguese (95.8%, a difference of 0.010%), Bahamian (95.7%, a difference of 0.010%), Dutch West Indian (95.8%, a difference of 0.040%), and Hawaiian (95.8%, a difference of 0.040%).
| Demographics | Rating | Rank | 7th Grade |
| Africans | 17.6 /100 | #206 | Poor 95.8% |
| Navajo | 17.0 /100 | #207 | Poor 95.8% |
| Immigrants | Sudan | 17.0 /100 | #208 | Poor 95.8% |
| Dutch West Indians | 16.1 /100 | #209 | Poor 95.8% |
| Hawaiians | 16.0 /100 | #210 | Poor 95.8% |
| Portuguese | 13.6 /100 | #211 | Poor 95.8% |
| Immigrants | Lebanon | 13.0 /100 | #212 | Poor 95.8% |
| Immigrants | Morocco | 12.6 /100 | #213 | Poor 95.8% |
| Bahamians | 11.6 /100 | #214 | Poor 95.7% |
| Spanish Americans | 9.3 /100 | #215 | Tragic 95.7% |
| Immigrants | Chile | 9.1 /100 | #216 | Tragic 95.7% |
| Immigrants | Pakistan | 9.0 /100 | #217 | Tragic 95.7% |
| Immigrants | Liberia | 8.1 /100 | #218 | Tragic 95.7% |
| Immigrants | Southern Europe | 7.9 /100 | #219 | Tragic 95.7% |
| Sub-Saharan Africans | 7.2 /100 | #220 | Tragic 95.7% |
Demographics Similar to Yup'ik by 7th Grade
In terms of 7th grade, the demographic groups most similar to Yup'ik are Inupiat (97.4%, a difference of 0.010%), French Canadian (97.4%, a difference of 0.020%), Croatian (97.4%, a difference of 0.030%), Lithuanian (97.5%, a difference of 0.040%), and Tlingit-Haida (97.5%, a difference of 0.050%).
| Demographics | Rating | Rank | 7th Grade |
| Swedes | 100.0 /100 | #13 | Exceptional 97.6% |
| Pennsylvania Germans | 100.0 /100 | #14 | Exceptional 97.6% |
| English | 100.0 /100 | #15 | Exceptional 97.6% |
| Irish | 100.0 /100 | #16 | Exceptional 97.5% |
| Scottish | 100.0 /100 | #17 | Exceptional 97.5% |
| Tlingit-Haida | 100.0 /100 | #18 | Exceptional 97.5% |
| Lithuanians | 100.0 /100 | #19 | Exceptional 97.5% |
| Yup'ik | 100.0 /100 | #20 | Exceptional 97.4% |
| Inupiat | 100.0 /100 | #21 | Exceptional 97.4% |
| French Canadians | 100.0 /100 | #22 | Exceptional 97.4% |
| Croatians | 100.0 /100 | #23 | Exceptional 97.4% |
| Welsh | 100.0 /100 | #24 | Exceptional 97.4% |
| French | 100.0 /100 | #25 | Exceptional 97.4% |
| Scotch-Irish | 100.0 /100 | #26 | Exceptional 97.4% |
| Danes | 100.0 /100 | #27 | Exceptional 97.4% |