Immigrants from Vietnam vs Paiute 5th Grade
COMPARE
Immigrants from Vietnam
Paiute
5th Grade
5th Grade Comparison
Immigrants from Vietnam
Paiute
95.8%
5TH GRADE
0.0/ 100
METRIC RATING
318th/ 347
METRIC RANK
97.1%
5TH GRADE
11.6/ 100
METRIC RATING
206th/ 347
METRIC RANK
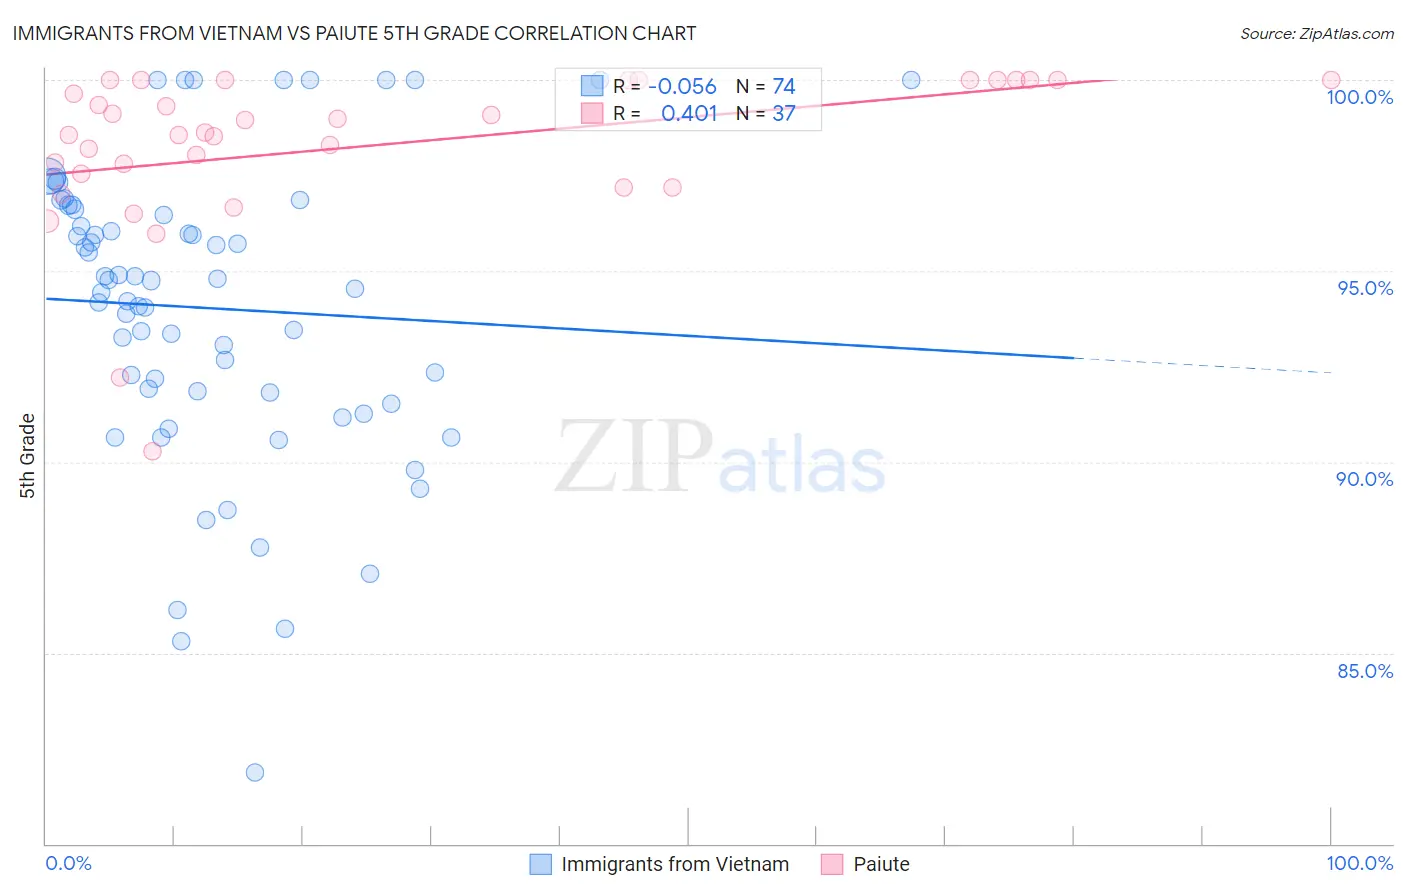
Immigrants from Vietnam vs Paiute 5th Grade Correlation Chart
The statistical analysis conducted on geographies consisting of 404,844,130 people shows a slight negative correlation between the proportion of Immigrants from Vietnam and percentage of population with at least 5th grade education in the United States with a correlation coefficient (R) of -0.056 and weighted average of 95.8%. Similarly, the statistical analysis conducted on geographies consisting of 58,402,332 people shows a moderate positive correlation between the proportion of Paiute and percentage of population with at least 5th grade education in the United States with a correlation coefficient (R) of 0.401 and weighted average of 97.1%, a difference of 1.4%.
5th Grade Correlation Summary
| Measurement | Immigrants from Vietnam | Paiute |
| Minimum | 81.9% | 90.3% |
| Maximum | 100.0% | 100.0% |
| Range | 18.1% | 9.7% |
| Mean | 94.0% | 98.3% |
| Median | 94.6% | 98.6% |
| Interquartile 25% (IQ1) | 91.8% | 97.4% |
| Interquartile 75% (IQ3) | 96.6% | 100.0% |
| Interquartile Range (IQR) | 4.8% | 2.6% |
| Standard Deviation (Sample) | 3.9% | 2.1% |
| Standard Deviation (Population) | 3.9% | 2.1% |
Similar Demographics by 5th Grade
Demographics Similar to Immigrants from Vietnam by 5th Grade
In terms of 5th grade, the demographic groups most similar to Immigrants from Vietnam are Belizean (95.8%, a difference of 0.030%), Immigrants from Ecuador (95.8%, a difference of 0.050%), Japanese (95.7%, a difference of 0.050%), Central American Indian (95.7%, a difference of 0.050%), and Nicaraguan (95.9%, a difference of 0.12%).
| Demographics | Rating | Rank | 5th Grade |
| Immigrants | Bangladesh | 0.0 /100 | #311 | Tragic 96.0% |
| Vietnamese | 0.0 /100 | #312 | Tragic 95.9% |
| Bangladeshis | 0.0 /100 | #313 | Tragic 95.9% |
| Immigrants | Portugal | 0.0 /100 | #314 | Tragic 95.9% |
| Nicaraguans | 0.0 /100 | #315 | Tragic 95.9% |
| Immigrants | Ecuador | 0.0 /100 | #316 | Tragic 95.8% |
| Belizeans | 0.0 /100 | #317 | Tragic 95.8% |
| Immigrants | Vietnam | 0.0 /100 | #318 | Tragic 95.8% |
| Japanese | 0.0 /100 | #319 | Tragic 95.7% |
| Central American Indians | 0.0 /100 | #320 | Tragic 95.7% |
| Immigrants | Belize | 0.0 /100 | #321 | Tragic 95.7% |
| Immigrants | Nicaragua | 0.0 /100 | #322 | Tragic 95.6% |
| Immigrants | Fiji | 0.0 /100 | #323 | Tragic 95.6% |
| Hondurans | 0.0 /100 | #324 | Tragic 95.6% |
| Hispanics or Latinos | 0.0 /100 | #325 | Tragic 95.6% |
Demographics Similar to Paiute by 5th Grade
In terms of 5th grade, the demographic groups most similar to Paiute are Moroccan (97.1%, a difference of 0.0%), Iraqi (97.1%, a difference of 0.010%), Laotian (97.1%, a difference of 0.010%), Immigrants from Nepal (97.1%, a difference of 0.010%), and Immigrants from Zaire (97.1%, a difference of 0.020%).
| Demographics | Rating | Rank | 5th Grade |
| Natives/Alaskans | 18.0 /100 | #199 | Poor 97.2% |
| Immigrants | Northern Africa | 16.8 /100 | #200 | Poor 97.2% |
| Immigrants | Chile | 16.6 /100 | #201 | Poor 97.2% |
| Africans | 15.3 /100 | #202 | Poor 97.2% |
| Immigrants | Bahamas | 14.9 /100 | #203 | Poor 97.2% |
| Immigrants | Zaire | 13.7 /100 | #204 | Poor 97.1% |
| Moroccans | 12.0 /100 | #205 | Poor 97.1% |
| Paiute | 11.6 /100 | #206 | Poor 97.1% |
| Iraqis | 10.9 /100 | #207 | Poor 97.1% |
| Laotians | 10.8 /100 | #208 | Poor 97.1% |
| Immigrants | Nepal | 10.3 /100 | #209 | Poor 97.1% |
| Immigrants | Oceania | 10.0 /100 | #210 | Poor 97.1% |
| Samoans | 8.5 /100 | #211 | Tragic 97.1% |
| Immigrants | Iraq | 8.3 /100 | #212 | Tragic 97.1% |
| Portuguese | 7.8 /100 | #213 | Tragic 97.1% |