Immigrants from Uzbekistan vs Shoshone 12th Grade, No Diploma
COMPARE
Immigrants from Uzbekistan
Shoshone
12th Grade, No Diploma
12th Grade, No Diploma Comparison
Immigrants from Uzbekistan
Shoshone
90.1%
12TH GRADE, NO DIPLOMA
2.2/ 100
METRIC RATING
236th/ 347
METRIC RANK
90.5%
12TH GRADE, NO DIPLOMA
7.5/ 100
METRIC RATING
216th/ 347
METRIC RANK
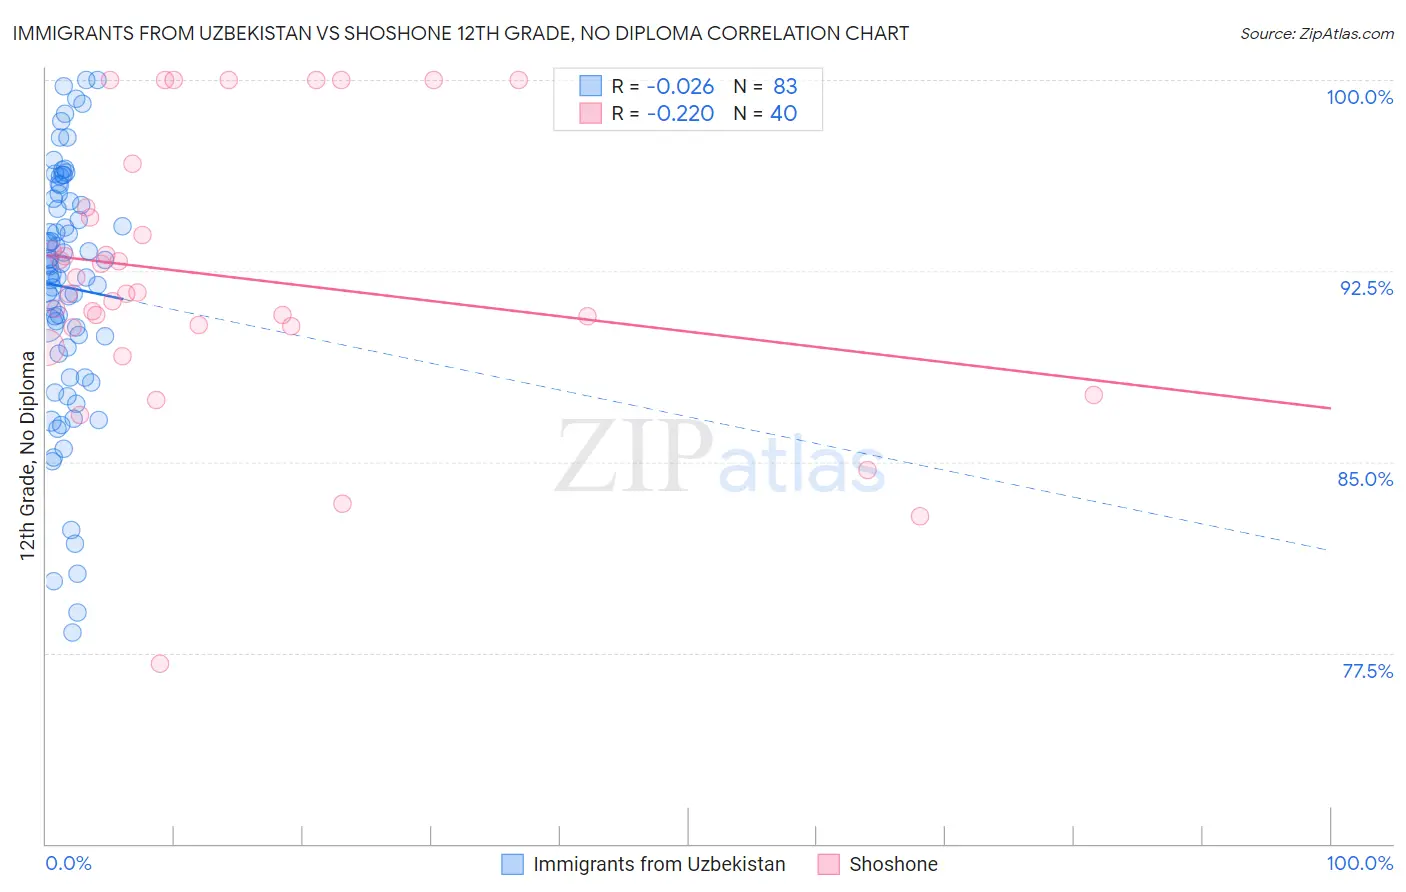
Immigrants from Uzbekistan vs Shoshone 12th Grade, No Diploma Correlation Chart
The statistical analysis conducted on geographies consisting of 118,765,305 people shows no correlation between the proportion of Immigrants from Uzbekistan and percentage of population with at least 12th grade (no diploma) education in the United States with a correlation coefficient (R) of -0.026 and weighted average of 90.1%. Similarly, the statistical analysis conducted on geographies consisting of 66,627,351 people shows a weak negative correlation between the proportion of Shoshone and percentage of population with at least 12th grade (no diploma) education in the United States with a correlation coefficient (R) of -0.220 and weighted average of 90.5%, a difference of 0.39%.
12th Grade, No Diploma Correlation Summary
| Measurement | Immigrants from Uzbekistan | Shoshone |
| Minimum | 78.3% | 77.1% |
| Maximum | 100.0% | 100.0% |
| Range | 21.7% | 22.9% |
| Mean | 91.9% | 92.3% |
| Median | 92.7% | 91.6% |
| Interquartile 25% (IQ1) | 89.2% | 90.3% |
| Interquartile 75% (IQ3) | 95.3% | 94.8% |
| Interquartile Range (IQR) | 6.1% | 4.5% |
| Standard Deviation (Sample) | 4.9% | 5.3% |
| Standard Deviation (Population) | 4.9% | 5.2% |
Demographics Similar to Immigrants from Uzbekistan and Shoshone by 12th Grade, No Diploma
In terms of 12th grade, no diploma, the demographic groups most similar to Immigrants from Uzbekistan are Immigrants from Thailand (90.1%, a difference of 0.0%), Immigrants from South America (90.1%, a difference of 0.0%), Colville (90.1%, a difference of 0.0%), Blackfeet (90.1%, a difference of 0.020%), and Peruvian (90.2%, a difference of 0.060%). Similarly, the demographic groups most similar to Shoshone are Cherokee (90.5%, a difference of 0.0%), Immigrants from Cameroon (90.5%, a difference of 0.0%), Uruguayan (90.4%, a difference of 0.020%), Colombian (90.4%, a difference of 0.040%), and Immigrants from Liberia (90.4%, a difference of 0.090%).
| Demographics | Rating | Rank | 12th Grade, No Diploma |
| Shoshone | 7.5 /100 | #216 | Tragic 90.5% |
| Cherokee | 7.4 /100 | #217 | Tragic 90.5% |
| Immigrants | Cameroon | 7.4 /100 | #218 | Tragic 90.5% |
| Uruguayans | 7.0 /100 | #219 | Tragic 90.4% |
| Colombians | 6.6 /100 | #220 | Tragic 90.4% |
| Immigrants | Liberia | 5.7 /100 | #221 | Tragic 90.4% |
| Immigrants | Somalia | 5.3 /100 | #222 | Tragic 90.4% |
| South Americans | 5.0 /100 | #223 | Tragic 90.3% |
| Immigrants | Panama | 4.8 /100 | #224 | Tragic 90.3% |
| Chickasaw | 4.8 /100 | #225 | Tragic 90.3% |
| Immigrants | Zaire | 4.6 /100 | #226 | Tragic 90.3% |
| Nigerians | 4.5 /100 | #227 | Tragic 90.3% |
| Creek | 3.9 /100 | #228 | Tragic 90.3% |
| Immigrants | Bahamas | 3.6 /100 | #229 | Tragic 90.2% |
| Immigrants | Philippines | 2.8 /100 | #230 | Tragic 90.2% |
| Peruvians | 2.7 /100 | #231 | Tragic 90.2% |
| Blackfeet | 2.4 /100 | #232 | Tragic 90.1% |
| Immigrants | Thailand | 2.3 /100 | #233 | Tragic 90.1% |
| Immigrants | South America | 2.3 /100 | #234 | Tragic 90.1% |
| Colville | 2.3 /100 | #235 | Tragic 90.1% |
| Immigrants | Uzbekistan | 2.2 /100 | #236 | Tragic 90.1% |