Immigrants from Uzbekistan vs Ecuadorian 3rd Grade
COMPARE
Immigrants from Uzbekistan
Ecuadorian
3rd Grade
3rd Grade Comparison
Immigrants from Uzbekistan
Ecuadorians
97.2%
3RD GRADE
0.1/ 100
METRIC RATING
275th/ 347
METRIC RANK
96.7%
3RD GRADE
0.0/ 100
METRIC RATING
303rd/ 347
METRIC RANK
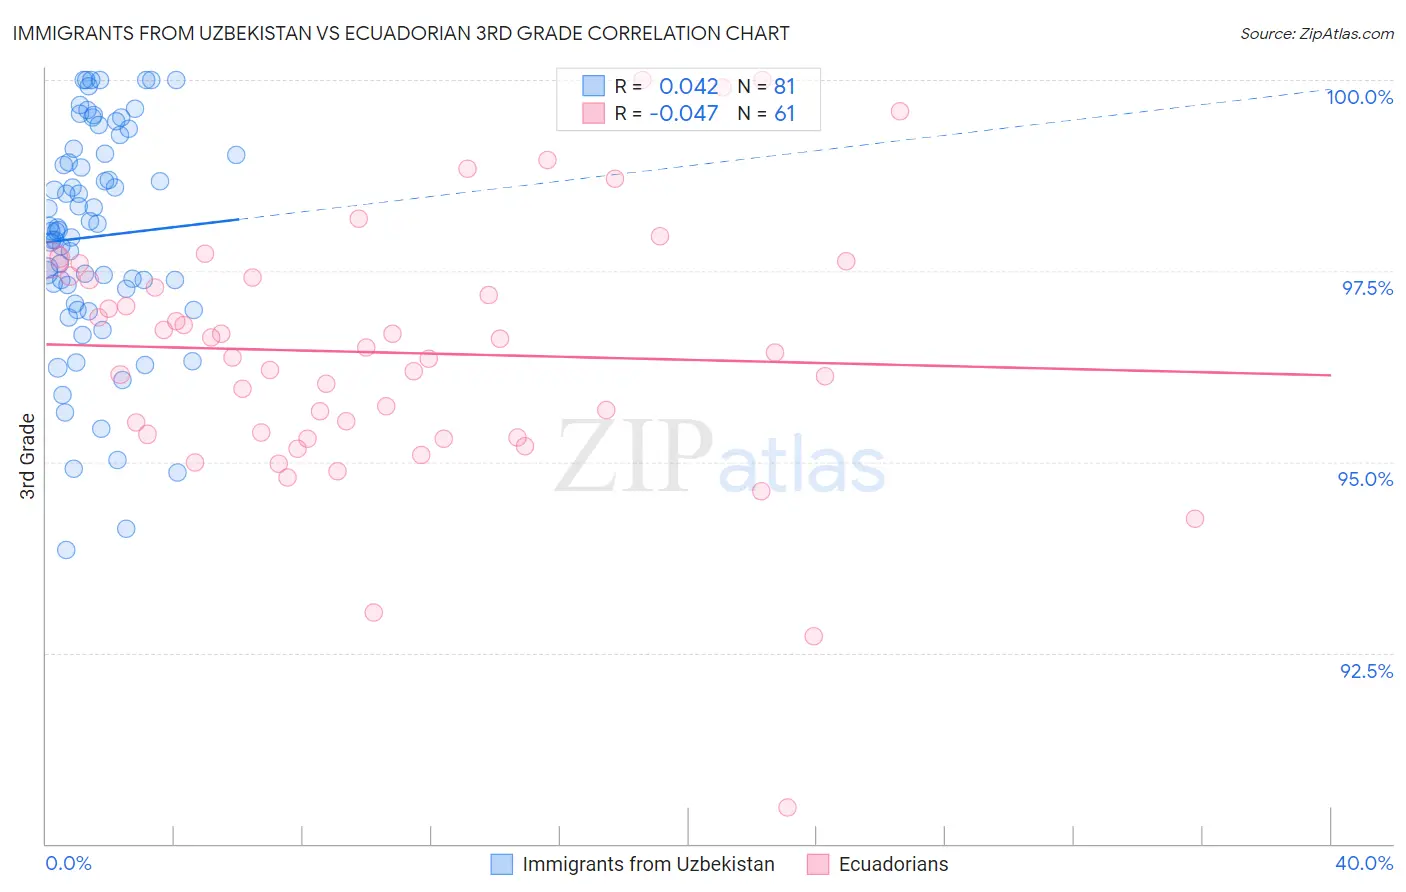
Immigrants from Uzbekistan vs Ecuadorian 3rd Grade Correlation Chart
The statistical analysis conducted on geographies consisting of 118,593,934 people shows no correlation between the proportion of Immigrants from Uzbekistan and percentage of population with at least 3rd grade education in the United States with a correlation coefficient (R) of 0.042 and weighted average of 97.2%. Similarly, the statistical analysis conducted on geographies consisting of 317,865,723 people shows no correlation between the proportion of Ecuadorians and percentage of population with at least 3rd grade education in the United States with a correlation coefficient (R) of -0.047 and weighted average of 96.7%, a difference of 0.46%.
3rd Grade Correlation Summary
| Measurement | Immigrants from Uzbekistan | Ecuadorian |
| Minimum | 93.8% | 90.5% |
| Maximum | 100.0% | 100.0% |
| Range | 6.2% | 9.5% |
| Mean | 98.0% | 96.4% |
| Median | 98.0% | 96.4% |
| Interquartile 25% (IQ1) | 97.2% | 95.3% |
| Interquartile 75% (IQ3) | 99.1% | 97.4% |
| Interquartile Range (IQR) | 1.9% | 2.1% |
| Standard Deviation (Sample) | 1.5% | 1.7% |
| Standard Deviation (Population) | 1.5% | 1.7% |
Similar Demographics by 3rd Grade
Demographics Similar to Immigrants from Uzbekistan by 3rd Grade
In terms of 3rd grade, the demographic groups most similar to Immigrants from Uzbekistan are Immigrants from Cameroon (97.2%, a difference of 0.020%), Immigrants from Bolivia (97.2%, a difference of 0.020%), Trinidadian and Tobagonian (97.2%, a difference of 0.020%), Immigrants from Western Africa (97.2%, a difference of 0.020%), and Immigrants from China (97.2%, a difference of 0.030%).
| Demographics | Rating | Rank | 3rd Grade |
| Cubans | 0.2 /100 | #268 | Tragic 97.3% |
| Fijians | 0.2 /100 | #269 | Tragic 97.3% |
| Immigrants | China | 0.2 /100 | #270 | Tragic 97.2% |
| Puerto Ricans | 0.2 /100 | #271 | Tragic 97.2% |
| Ghanaians | 0.1 /100 | #272 | Tragic 97.2% |
| Immigrants | Peru | 0.1 /100 | #273 | Tragic 97.2% |
| Immigrants | Cameroon | 0.1 /100 | #274 | Tragic 97.2% |
| Immigrants | Uzbekistan | 0.1 /100 | #275 | Tragic 97.2% |
| Immigrants | Bolivia | 0.1 /100 | #276 | Tragic 97.2% |
| Trinidadians and Tobagonians | 0.1 /100 | #277 | Tragic 97.2% |
| Immigrants | Western Africa | 0.1 /100 | #278 | Tragic 97.2% |
| Immigrants | Philippines | 0.1 /100 | #279 | Tragic 97.2% |
| Immigrants | Ghana | 0.1 /100 | #280 | Tragic 97.2% |
| Barbadians | 0.1 /100 | #281 | Tragic 97.2% |
| Afghans | 0.1 /100 | #282 | Tragic 97.1% |
Demographics Similar to Ecuadorians by 3rd Grade
In terms of 3rd grade, the demographic groups most similar to Ecuadorians are Immigrants from Somalia (96.8%, a difference of 0.010%), Immigrants from Caribbean (96.7%, a difference of 0.020%), Central American Indian (96.7%, a difference of 0.030%), Guyanese (96.7%, a difference of 0.060%), and Immigrants from Cuba (96.8%, a difference of 0.080%).
| Demographics | Rating | Rank | 3rd Grade |
| Immigrants | Immigrants | 0.0 /100 | #296 | Tragic 96.9% |
| Haitians | 0.0 /100 | #297 | Tragic 96.9% |
| Immigrants | Dominica | 0.0 /100 | #298 | Tragic 96.9% |
| Somalis | 0.0 /100 | #299 | Tragic 96.8% |
| Immigrants | South Eastern Asia | 0.0 /100 | #300 | Tragic 96.8% |
| Immigrants | Cuba | 0.0 /100 | #301 | Tragic 96.8% |
| Immigrants | Somalia | 0.0 /100 | #302 | Tragic 96.8% |
| Ecuadorians | 0.0 /100 | #303 | Tragic 96.7% |
| Immigrants | Caribbean | 0.0 /100 | #304 | Tragic 96.7% |
| Central American Indians | 0.0 /100 | #305 | Tragic 96.7% |
| Guyanese | 0.0 /100 | #306 | Tragic 96.7% |
| Nicaraguans | 0.0 /100 | #307 | Tragic 96.7% |
| Immigrants | Haiti | 0.0 /100 | #308 | Tragic 96.7% |
| Sri Lankans | 0.0 /100 | #309 | Tragic 96.7% |
| Cape Verdeans | 0.0 /100 | #310 | Tragic 96.6% |