Immigrants from Uzbekistan vs Immigrants from Spain 3rd Grade
COMPARE
Immigrants from Uzbekistan
Immigrants from Spain
3rd Grade
3rd Grade Comparison
Immigrants from Uzbekistan
Immigrants from Spain
97.2%
3RD GRADE
0.1/ 100
METRIC RATING
275th/ 347
METRIC RANK
97.8%
3RD GRADE
54.3/ 100
METRIC RATING
168th/ 347
METRIC RANK
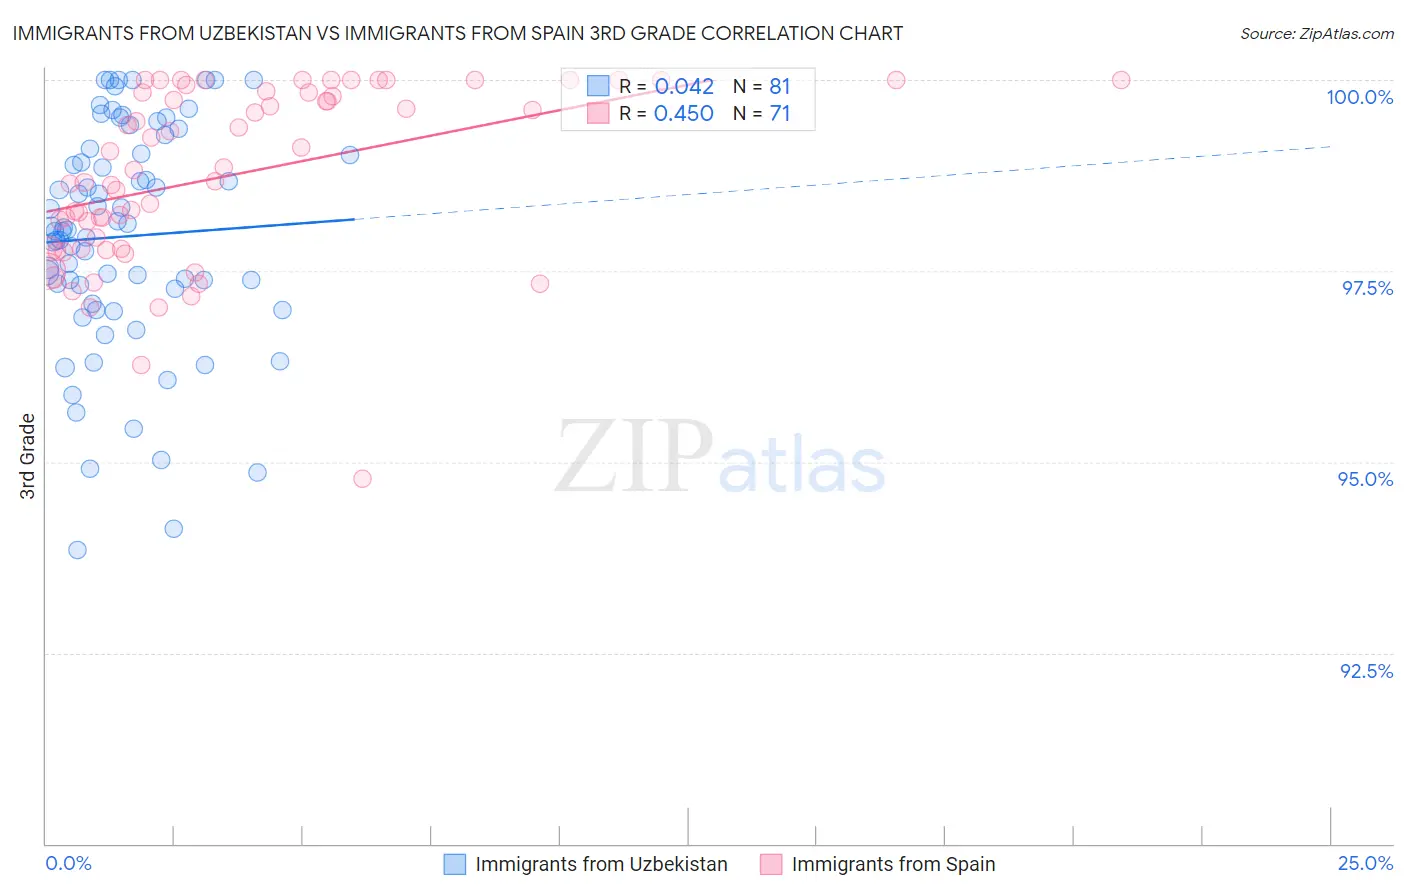
Immigrants from Uzbekistan vs Immigrants from Spain 3rd Grade Correlation Chart
The statistical analysis conducted on geographies consisting of 118,593,934 people shows no correlation between the proportion of Immigrants from Uzbekistan and percentage of population with at least 3rd grade education in the United States with a correlation coefficient (R) of 0.042 and weighted average of 97.2%. Similarly, the statistical analysis conducted on geographies consisting of 239,682,160 people shows a moderate positive correlation between the proportion of Immigrants from Spain and percentage of population with at least 3rd grade education in the United States with a correlation coefficient (R) of 0.450 and weighted average of 97.8%, a difference of 0.60%.
3rd Grade Correlation Summary
| Measurement | Immigrants from Uzbekistan | Immigrants from Spain |
| Minimum | 93.8% | 94.8% |
| Maximum | 100.0% | 100.0% |
| Range | 6.2% | 5.2% |
| Mean | 98.0% | 98.8% |
| Median | 98.0% | 98.8% |
| Interquartile 25% (IQ1) | 97.2% | 97.8% |
| Interquartile 75% (IQ3) | 99.1% | 99.8% |
| Interquartile Range (IQR) | 1.9% | 2.1% |
| Standard Deviation (Sample) | 1.5% | 1.1% |
| Standard Deviation (Population) | 1.5% | 1.1% |
Similar Demographics by 3rd Grade
Demographics Similar to Immigrants from Uzbekistan by 3rd Grade
In terms of 3rd grade, the demographic groups most similar to Immigrants from Uzbekistan are Immigrants from Cameroon (97.2%, a difference of 0.020%), Immigrants from Bolivia (97.2%, a difference of 0.020%), Trinidadian and Tobagonian (97.2%, a difference of 0.020%), Immigrants from Western Africa (97.2%, a difference of 0.020%), and Immigrants from China (97.2%, a difference of 0.030%).
| Demographics | Rating | Rank | 3rd Grade |
| Cubans | 0.2 /100 | #268 | Tragic 97.3% |
| Fijians | 0.2 /100 | #269 | Tragic 97.3% |
| Immigrants | China | 0.2 /100 | #270 | Tragic 97.2% |
| Puerto Ricans | 0.2 /100 | #271 | Tragic 97.2% |
| Ghanaians | 0.1 /100 | #272 | Tragic 97.2% |
| Immigrants | Peru | 0.1 /100 | #273 | Tragic 97.2% |
| Immigrants | Cameroon | 0.1 /100 | #274 | Tragic 97.2% |
| Immigrants | Uzbekistan | 0.1 /100 | #275 | Tragic 97.2% |
| Immigrants | Bolivia | 0.1 /100 | #276 | Tragic 97.2% |
| Trinidadians and Tobagonians | 0.1 /100 | #277 | Tragic 97.2% |
| Immigrants | Western Africa | 0.1 /100 | #278 | Tragic 97.2% |
| Immigrants | Philippines | 0.1 /100 | #279 | Tragic 97.2% |
| Immigrants | Ghana | 0.1 /100 | #280 | Tragic 97.2% |
| Barbadians | 0.1 /100 | #281 | Tragic 97.2% |
| Afghans | 0.1 /100 | #282 | Tragic 97.1% |
Demographics Similar to Immigrants from Spain by 3rd Grade
In terms of 3rd grade, the demographic groups most similar to Immigrants from Spain are Dutch West Indian (97.8%, a difference of 0.0%), Chilean (97.8%, a difference of 0.0%), Comanche (97.8%, a difference of 0.0%), Brazilian (97.8%, a difference of 0.0%), and Immigrants from Jordan (97.8%, a difference of 0.010%).
| Demographics | Rating | Rank | 3rd Grade |
| Albanians | 58.8 /100 | #161 | Average 97.8% |
| Immigrants | Jordan | 57.9 /100 | #162 | Average 97.8% |
| Marshallese | 57.2 /100 | #163 | Average 97.8% |
| Immigrants | Bosnia and Herzegovina | 56.2 /100 | #164 | Average 97.8% |
| Ugandans | 56.1 /100 | #165 | Average 97.8% |
| Dutch West Indians | 55.5 /100 | #166 | Average 97.8% |
| Chileans | 55.3 /100 | #167 | Average 97.8% |
| Immigrants | Spain | 54.3 /100 | #168 | Average 97.8% |
| Comanche | 53.8 /100 | #169 | Average 97.8% |
| Brazilians | 53.7 /100 | #170 | Average 97.8% |
| Kenyans | 51.8 /100 | #171 | Average 97.8% |
| Spanish Americans | 51.8 /100 | #172 | Average 97.8% |
| Immigrants | Korea | 50.9 /100 | #173 | Average 97.8% |
| Navajo | 50.0 /100 | #174 | Average 97.8% |
| Immigrants | Micronesia | 47.6 /100 | #175 | Average 97.8% |