Immigrants from Uruguay vs Creek Professional Degree
COMPARE
Immigrants from Uruguay
Creek
Professional Degree
Professional Degree Comparison
Immigrants from Uruguay
Creek
4.6%
PROFESSIONAL DEGREE
72.5/ 100
METRIC RATING
153rd/ 347
METRIC RANK
3.1%
PROFESSIONAL DEGREE
0.0/ 100
METRIC RATING
328th/ 347
METRIC RANK
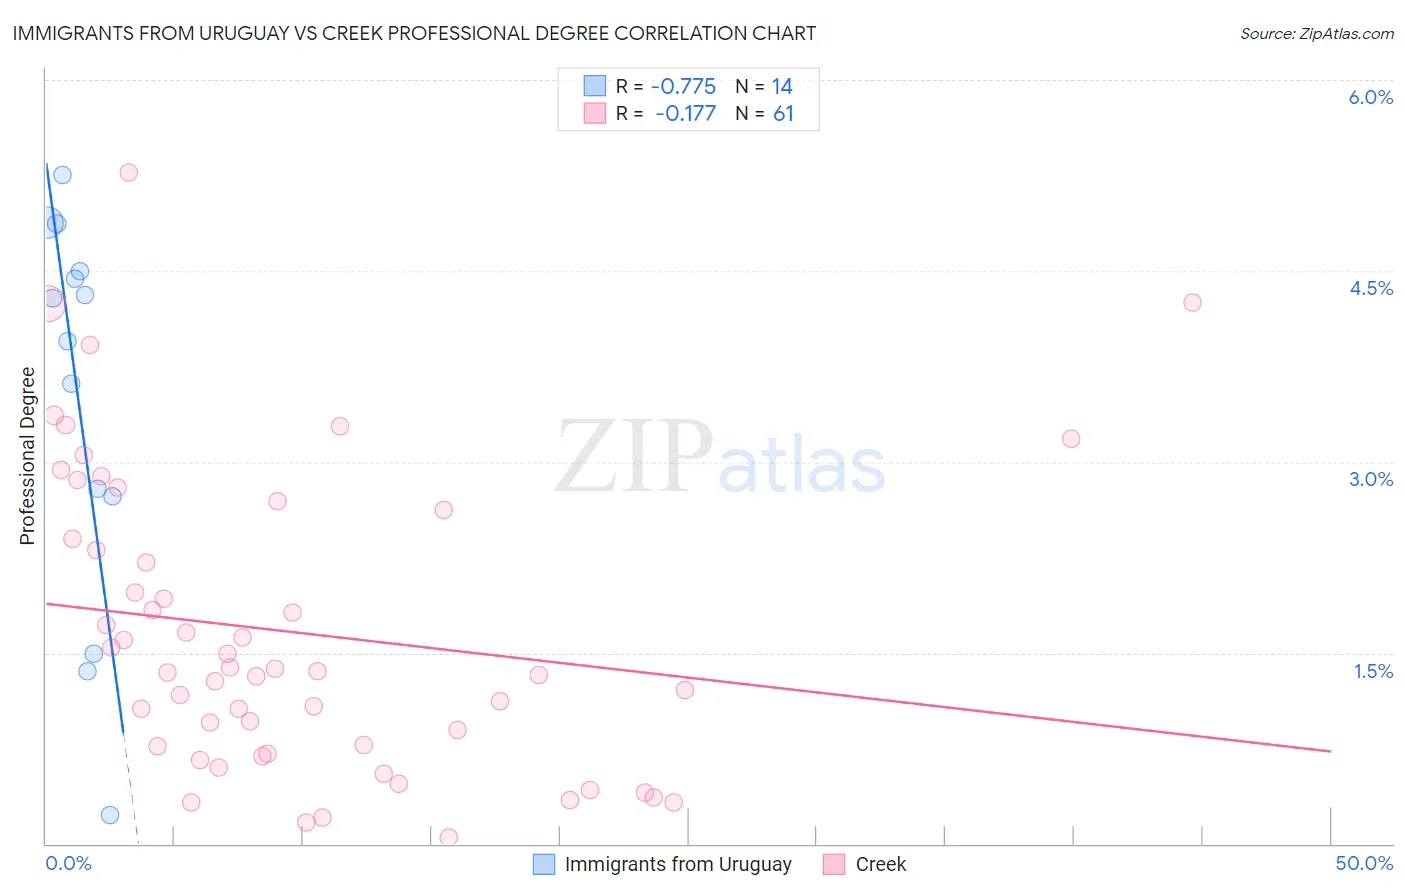
Immigrants from Uruguay vs Creek Professional Degree Correlation Chart
The statistical analysis conducted on geographies consisting of 133,217,202 people shows a strong negative correlation between the proportion of Immigrants from Uruguay and percentage of population with at least professional degree education in the United States with a correlation coefficient (R) of -0.775 and weighted average of 4.6%. Similarly, the statistical analysis conducted on geographies consisting of 177,945,536 people shows a poor negative correlation between the proportion of Creek and percentage of population with at least professional degree education in the United States with a correlation coefficient (R) of -0.177 and weighted average of 3.1%, a difference of 47.3%.
Professional Degree Correlation Summary
| Measurement | Immigrants from Uruguay | Creek |
| Minimum | 0.22% | 0.045% |
| Maximum | 5.3% | 5.3% |
| Range | 5.0% | 5.2% |
| Mean | 3.5% | 1.7% |
| Median | 4.1% | 1.4% |
| Interquartile 25% (IQ1) | 2.7% | 0.73% |
| Interquartile 75% (IQ3) | 4.5% | 2.5% |
| Interquartile Range (IQR) | 1.8% | 1.8% |
| Standard Deviation (Sample) | 1.5% | 1.2% |
| Standard Deviation (Population) | 1.5% | 1.2% |
Similar Demographics by Professional Degree
Demographics Similar to Immigrants from Uruguay by Professional Degree
In terms of professional degree, the demographic groups most similar to Immigrants from Uruguay are Immigrants from Africa (4.6%, a difference of 0.0%), Polish (4.6%, a difference of 0.020%), Scottish (4.6%, a difference of 0.12%), Immigrants from Oceania (4.6%, a difference of 0.16%), and Slavic (4.5%, a difference of 0.30%).
| Demographics | Rating | Rank | Professional Degree |
| Luxembourgers | 78.7 /100 | #146 | Good 4.6% |
| Colombians | 77.7 /100 | #147 | Good 4.6% |
| Slovenes | 76.1 /100 | #148 | Good 4.6% |
| Senegalese | 75.3 /100 | #149 | Good 4.6% |
| Immigrants | Oceania | 73.4 /100 | #150 | Good 4.6% |
| Poles | 72.6 /100 | #151 | Good 4.6% |
| Immigrants | Africa | 72.5 /100 | #152 | Good 4.6% |
| Immigrants | Uruguay | 72.5 /100 | #153 | Good 4.6% |
| Scottish | 71.8 /100 | #154 | Good 4.6% |
| Slavs | 70.8 /100 | #155 | Good 4.5% |
| Swedes | 69.9 /100 | #156 | Good 4.5% |
| Iraqis | 69.8 /100 | #157 | Good 4.5% |
| Immigrants | Armenia | 68.8 /100 | #158 | Good 4.5% |
| Vietnamese | 68.4 /100 | #159 | Good 4.5% |
| Immigrants | Senegal | 68.0 /100 | #160 | Good 4.5% |
Demographics Similar to Creek by Professional Degree
In terms of professional degree, the demographic groups most similar to Creek are Dutch West Indian (3.1%, a difference of 0.060%), Menominee (3.1%, a difference of 0.16%), Bangladeshi (3.1%, a difference of 0.21%), Immigrants from Cabo Verde (3.1%, a difference of 0.29%), and Kiowa (3.1%, a difference of 0.41%).
| Demographics | Rating | Rank | Professional Degree |
| Tsimshian | 0.0 /100 | #321 | Tragic 3.2% |
| Hispanics or Latinos | 0.0 /100 | #322 | Tragic 3.2% |
| Inupiat | 0.0 /100 | #323 | Tragic 3.2% |
| Crow | 0.0 /100 | #324 | Tragic 3.2% |
| Yaqui | 0.0 /100 | #325 | Tragic 3.2% |
| Menominee | 0.0 /100 | #326 | Tragic 3.1% |
| Dutch West Indians | 0.0 /100 | #327 | Tragic 3.1% |
| Creek | 0.0 /100 | #328 | Tragic 3.1% |
| Bangladeshis | 0.0 /100 | #329 | Tragic 3.1% |
| Immigrants | Cabo Verde | 0.0 /100 | #330 | Tragic 3.1% |
| Kiowa | 0.0 /100 | #331 | Tragic 3.1% |
| Yakama | 0.0 /100 | #332 | Tragic 3.1% |
| Puget Sound Salish | 0.0 /100 | #333 | Tragic 3.1% |
| Pennsylvania Germans | 0.0 /100 | #334 | Tragic 3.0% |
| Natives/Alaskans | 0.0 /100 | #335 | Tragic 3.0% |