Immigrants from Fiji vs Creek Professional Degree
COMPARE
Immigrants from Fiji
Creek
Professional Degree
Professional Degree Comparison
Immigrants from Fiji
Creek
3.7%
PROFESSIONAL DEGREE
1.5/ 100
METRIC RATING
250th/ 347
METRIC RANK
3.1%
PROFESSIONAL DEGREE
0.0/ 100
METRIC RATING
328th/ 347
METRIC RANK
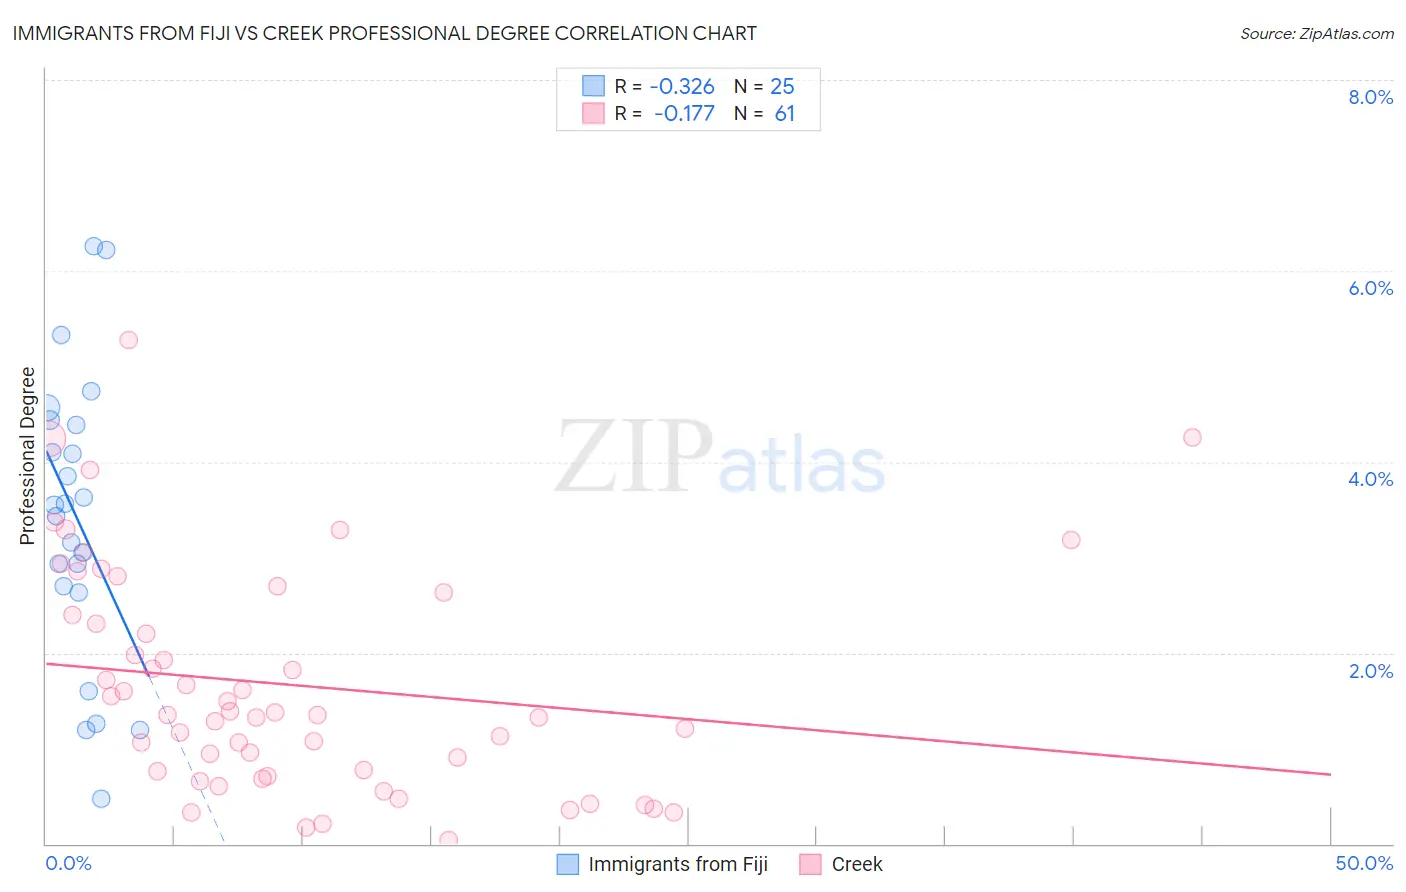
Immigrants from Fiji vs Creek Professional Degree Correlation Chart
The statistical analysis conducted on geographies consisting of 93,709,479 people shows a mild negative correlation between the proportion of Immigrants from Fiji and percentage of population with at least professional degree education in the United States with a correlation coefficient (R) of -0.326 and weighted average of 3.7%. Similarly, the statistical analysis conducted on geographies consisting of 177,945,536 people shows a poor negative correlation between the proportion of Creek and percentage of population with at least professional degree education in the United States with a correlation coefficient (R) of -0.177 and weighted average of 3.1%, a difference of 20.8%.
Professional Degree Correlation Summary
| Measurement | Immigrants from Fiji | Creek |
| Minimum | 0.47% | 0.045% |
| Maximum | 6.3% | 5.3% |
| Range | 5.8% | 5.2% |
| Mean | 3.4% | 1.7% |
| Median | 3.5% | 1.4% |
| Interquartile 25% (IQ1) | 2.7% | 0.73% |
| Interquartile 75% (IQ3) | 4.4% | 2.5% |
| Interquartile Range (IQR) | 1.7% | 1.8% |
| Standard Deviation (Sample) | 1.5% | 1.2% |
| Standard Deviation (Population) | 1.5% | 1.2% |
Similar Demographics by Professional Degree
Demographics Similar to Immigrants from Fiji by Professional Degree
In terms of professional degree, the demographic groups most similar to Immigrants from Fiji are Immigrants from Grenada (3.7%, a difference of 0.060%), Hmong (3.7%, a difference of 0.18%), Immigrants from Nicaragua (3.7%, a difference of 0.25%), Guyanese (3.8%, a difference of 0.34%), and Marshallese (3.8%, a difference of 0.36%).
| Demographics | Rating | Rank | Professional Degree |
| Guamanians/Chamorros | 2.2 /100 | #243 | Tragic 3.8% |
| Immigrants | Bahamas | 2.0 /100 | #244 | Tragic 3.8% |
| French American Indians | 1.7 /100 | #245 | Tragic 3.8% |
| Marshallese | 1.7 /100 | #246 | Tragic 3.8% |
| Guyanese | 1.6 /100 | #247 | Tragic 3.8% |
| Hmong | 1.6 /100 | #248 | Tragic 3.7% |
| Immigrants | Grenada | 1.5 /100 | #249 | Tragic 3.7% |
| Immigrants | Fiji | 1.5 /100 | #250 | Tragic 3.7% |
| Immigrants | Nicaragua | 1.4 /100 | #251 | Tragic 3.7% |
| Jamaicans | 1.4 /100 | #252 | Tragic 3.7% |
| Pueblo | 1.4 /100 | #253 | Tragic 3.7% |
| Tongans | 1.3 /100 | #254 | Tragic 3.7% |
| Osage | 1.2 /100 | #255 | Tragic 3.7% |
| Iroquois | 1.2 /100 | #256 | Tragic 3.7% |
| Bahamians | 1.1 /100 | #257 | Tragic 3.7% |
Demographics Similar to Creek by Professional Degree
In terms of professional degree, the demographic groups most similar to Creek are Dutch West Indian (3.1%, a difference of 0.060%), Menominee (3.1%, a difference of 0.16%), Bangladeshi (3.1%, a difference of 0.21%), Immigrants from Cabo Verde (3.1%, a difference of 0.29%), and Kiowa (3.1%, a difference of 0.41%).
| Demographics | Rating | Rank | Professional Degree |
| Tsimshian | 0.0 /100 | #321 | Tragic 3.2% |
| Hispanics or Latinos | 0.0 /100 | #322 | Tragic 3.2% |
| Inupiat | 0.0 /100 | #323 | Tragic 3.2% |
| Crow | 0.0 /100 | #324 | Tragic 3.2% |
| Yaqui | 0.0 /100 | #325 | Tragic 3.2% |
| Menominee | 0.0 /100 | #326 | Tragic 3.1% |
| Dutch West Indians | 0.0 /100 | #327 | Tragic 3.1% |
| Creek | 0.0 /100 | #328 | Tragic 3.1% |
| Bangladeshis | 0.0 /100 | #329 | Tragic 3.1% |
| Immigrants | Cabo Verde | 0.0 /100 | #330 | Tragic 3.1% |
| Kiowa | 0.0 /100 | #331 | Tragic 3.1% |
| Yakama | 0.0 /100 | #332 | Tragic 3.1% |
| Puget Sound Salish | 0.0 /100 | #333 | Tragic 3.1% |
| Pennsylvania Germans | 0.0 /100 | #334 | Tragic 3.0% |
| Natives/Alaskans | 0.0 /100 | #335 | Tragic 3.0% |