Immigrants from Uruguay vs Guatemalan Professional Degree
COMPARE
Immigrants from Uruguay
Guatemalan
Professional Degree
Professional Degree Comparison
Immigrants from Uruguay
Guatemalans
4.6%
PROFESSIONAL DEGREE
72.5/ 100
METRIC RATING
153rd/ 347
METRIC RANK
3.5%
PROFESSIONAL DEGREE
0.3/ 100
METRIC RATING
289th/ 347
METRIC RANK
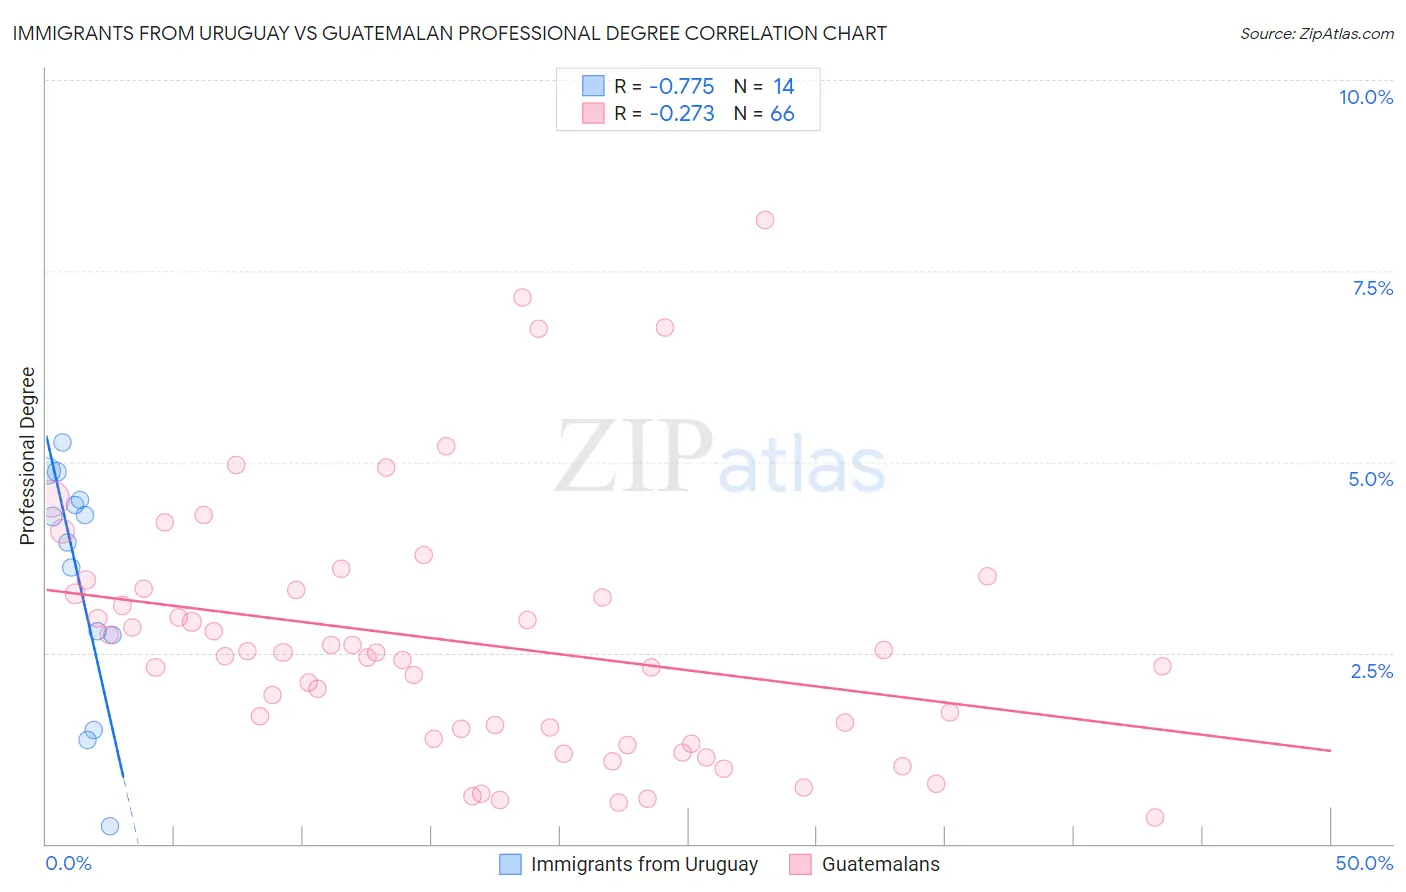
Immigrants from Uruguay vs Guatemalan Professional Degree Correlation Chart
The statistical analysis conducted on geographies consisting of 133,217,202 people shows a strong negative correlation between the proportion of Immigrants from Uruguay and percentage of population with at least professional degree education in the United States with a correlation coefficient (R) of -0.775 and weighted average of 4.6%. Similarly, the statistical analysis conducted on geographies consisting of 408,165,670 people shows a weak negative correlation between the proportion of Guatemalans and percentage of population with at least professional degree education in the United States with a correlation coefficient (R) of -0.273 and weighted average of 3.5%, a difference of 31.5%.
Professional Degree Correlation Summary
| Measurement | Immigrants from Uruguay | Guatemalan |
| Minimum | 0.22% | 0.34% |
| Maximum | 5.3% | 8.2% |
| Range | 5.0% | 7.8% |
| Mean | 3.5% | 2.6% |
| Median | 4.1% | 2.5% |
| Interquartile 25% (IQ1) | 2.7% | 1.4% |
| Interquartile 75% (IQ3) | 4.5% | 3.3% |
| Interquartile Range (IQR) | 1.8% | 1.9% |
| Standard Deviation (Sample) | 1.5% | 1.7% |
| Standard Deviation (Population) | 1.5% | 1.7% |
Similar Demographics by Professional Degree
Demographics Similar to Immigrants from Uruguay by Professional Degree
In terms of professional degree, the demographic groups most similar to Immigrants from Uruguay are Immigrants from Africa (4.6%, a difference of 0.0%), Polish (4.6%, a difference of 0.020%), Scottish (4.6%, a difference of 0.12%), Immigrants from Oceania (4.6%, a difference of 0.16%), and Slavic (4.5%, a difference of 0.30%).
| Demographics | Rating | Rank | Professional Degree |
| Luxembourgers | 78.7 /100 | #146 | Good 4.6% |
| Colombians | 77.7 /100 | #147 | Good 4.6% |
| Slovenes | 76.1 /100 | #148 | Good 4.6% |
| Senegalese | 75.3 /100 | #149 | Good 4.6% |
| Immigrants | Oceania | 73.4 /100 | #150 | Good 4.6% |
| Poles | 72.6 /100 | #151 | Good 4.6% |
| Immigrants | Africa | 72.5 /100 | #152 | Good 4.6% |
| Immigrants | Uruguay | 72.5 /100 | #153 | Good 4.6% |
| Scottish | 71.8 /100 | #154 | Good 4.6% |
| Slavs | 70.8 /100 | #155 | Good 4.5% |
| Swedes | 69.9 /100 | #156 | Good 4.5% |
| Iraqis | 69.8 /100 | #157 | Good 4.5% |
| Immigrants | Armenia | 68.8 /100 | #158 | Good 4.5% |
| Vietnamese | 68.4 /100 | #159 | Good 4.5% |
| Immigrants | Senegal | 68.0 /100 | #160 | Good 4.5% |
Demographics Similar to Guatemalans by Professional Degree
In terms of professional degree, the demographic groups most similar to Guatemalans are Chippewa (3.5%, a difference of 0.010%), Blackfeet (3.5%, a difference of 0.17%), Alaska Native (3.5%, a difference of 0.18%), Immigrants from El Salvador (3.5%, a difference of 0.22%), and Immigrants from Belize (3.5%, a difference of 0.25%).
| Demographics | Rating | Rank | Professional Degree |
| Immigrants | Caribbean | 0.5 /100 | #282 | Tragic 3.5% |
| Comanche | 0.4 /100 | #283 | Tragic 3.5% |
| Salvadorans | 0.4 /100 | #284 | Tragic 3.5% |
| Hondurans | 0.3 /100 | #285 | Tragic 3.5% |
| Haitians | 0.3 /100 | #286 | Tragic 3.5% |
| Immigrants | El Salvador | 0.3 /100 | #287 | Tragic 3.5% |
| Blackfeet | 0.3 /100 | #288 | Tragic 3.5% |
| Guatemalans | 0.3 /100 | #289 | Tragic 3.5% |
| Chippewa | 0.3 /100 | #290 | Tragic 3.5% |
| Alaska Natives | 0.3 /100 | #291 | Tragic 3.5% |
| Immigrants | Belize | 0.3 /100 | #292 | Tragic 3.5% |
| Immigrants | Honduras | 0.3 /100 | #293 | Tragic 3.5% |
| Paiute | 0.3 /100 | #294 | Tragic 3.4% |
| Immigrants | Guatemala | 0.2 /100 | #295 | Tragic 3.4% |
| Hawaiians | 0.2 /100 | #296 | Tragic 3.4% |