Immigrants from Ukraine vs Peruvian 10th Grade
COMPARE
Immigrants from Ukraine
Peruvian
10th Grade
10th Grade Comparison
Immigrants from Ukraine
Peruvians
94.0%
10TH GRADE
81.5/ 100
METRIC RATING
147th/ 347
METRIC RANK
92.6%
10TH GRADE
0.4/ 100
METRIC RATING
264th/ 347
METRIC RANK
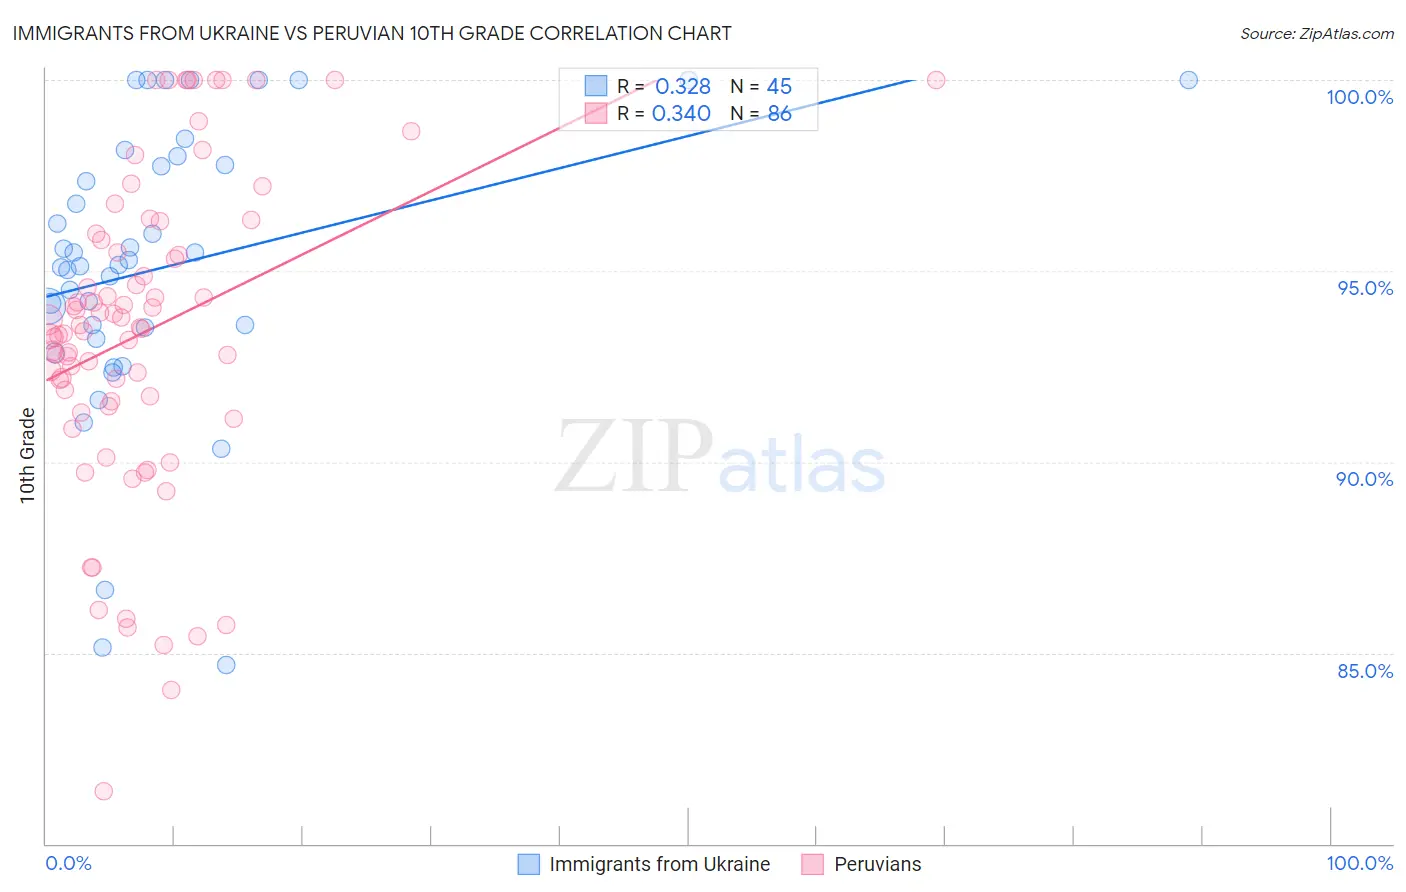
Immigrants from Ukraine vs Peruvian 10th Grade Correlation Chart
The statistical analysis conducted on geographies consisting of 289,714,613 people shows a mild positive correlation between the proportion of Immigrants from Ukraine and percentage of population with at least 10th grade education in the United States with a correlation coefficient (R) of 0.328 and weighted average of 94.0%. Similarly, the statistical analysis conducted on geographies consisting of 363,251,075 people shows a mild positive correlation between the proportion of Peruvians and percentage of population with at least 10th grade education in the United States with a correlation coefficient (R) of 0.340 and weighted average of 92.6%, a difference of 1.6%.
10th Grade Correlation Summary
| Measurement | Immigrants from Ukraine | Peruvian |
| Minimum | 84.7% | 81.4% |
| Maximum | 100.0% | 100.0% |
| Range | 15.3% | 18.6% |
| Mean | 95.1% | 93.4% |
| Median | 95.2% | 93.5% |
| Interquartile 25% (IQ1) | 93.4% | 91.6% |
| Interquartile 75% (IQ3) | 97.9% | 95.8% |
| Interquartile Range (IQR) | 4.5% | 4.2% |
| Standard Deviation (Sample) | 3.7% | 4.1% |
| Standard Deviation (Population) | 3.7% | 4.1% |
Similar Demographics by 10th Grade
Demographics Similar to Immigrants from Ukraine by 10th Grade
In terms of 10th grade, the demographic groups most similar to Immigrants from Ukraine are Arab (94.0%, a difference of 0.010%), Ugandan (94.0%, a difference of 0.010%), Chickasaw (94.1%, a difference of 0.020%), Egyptian (94.0%, a difference of 0.030%), and Kenyan (94.0%, a difference of 0.030%).
| Demographics | Rating | Rank | 10th Grade |
| Immigrants | Jordan | 87.6 /100 | #140 | Excellent 94.1% |
| Hmong | 86.6 /100 | #141 | Excellent 94.1% |
| Albanians | 86.5 /100 | #142 | Excellent 94.1% |
| Cherokee | 84.9 /100 | #143 | Excellent 94.1% |
| Immigrants | Kazakhstan | 84.9 /100 | #144 | Excellent 94.1% |
| Immigrants | Nonimmigrants | 83.8 /100 | #145 | Excellent 94.1% |
| Chickasaw | 82.6 /100 | #146 | Excellent 94.1% |
| Immigrants | Ukraine | 81.5 /100 | #147 | Excellent 94.0% |
| Arabs | 80.9 /100 | #148 | Excellent 94.0% |
| Ugandans | 80.7 /100 | #149 | Excellent 94.0% |
| Egyptians | 79.6 /100 | #150 | Good 94.0% |
| Kenyans | 79.1 /100 | #151 | Good 94.0% |
| Immigrants | Italy | 78.0 /100 | #152 | Good 94.0% |
| Immigrants | Brazil | 75.5 /100 | #153 | Good 94.0% |
| Immigrants | Kenya | 75.3 /100 | #154 | Good 94.0% |
Demographics Similar to Peruvians by 10th Grade
In terms of 10th grade, the demographic groups most similar to Peruvians are Immigrants from South America (92.6%, a difference of 0.0%), Apache (92.6%, a difference of 0.0%), Paiute (92.6%, a difference of 0.010%), Dutch West Indian (92.6%, a difference of 0.030%), and Immigrants from Philippines (92.6%, a difference of 0.030%).
| Demographics | Rating | Rank | 10th Grade |
| U.S. Virgin Islanders | 0.7 /100 | #257 | Tragic 92.7% |
| Immigrants | Costa Rica | 0.6 /100 | #258 | Tragic 92.7% |
| Immigrants | Jamaica | 0.5 /100 | #259 | Tragic 92.6% |
| Immigrants | Uzbekistan | 0.5 /100 | #260 | Tragic 92.6% |
| Paiute | 0.4 /100 | #261 | Tragic 92.6% |
| Immigrants | South America | 0.4 /100 | #262 | Tragic 92.6% |
| Apache | 0.4 /100 | #263 | Tragic 92.6% |
| Peruvians | 0.4 /100 | #264 | Tragic 92.6% |
| Dutch West Indians | 0.4 /100 | #265 | Tragic 92.6% |
| Immigrants | Philippines | 0.4 /100 | #266 | Tragic 92.6% |
| Taiwanese | 0.3 /100 | #267 | Tragic 92.5% |
| Immigrants | Ghana | 0.3 /100 | #268 | Tragic 92.5% |
| Immigrants | Colombia | 0.3 /100 | #269 | Tragic 92.5% |
| Immigrants | Uruguay | 0.3 /100 | #270 | Tragic 92.5% |
| Immigrants | Eritrea | 0.3 /100 | #271 | Tragic 92.5% |