Immigrants from Western Asia vs Peruvian 10th Grade
COMPARE
Immigrants from Western Asia
Peruvian
10th Grade
10th Grade Comparison
Immigrants from Western Asia
Peruvians
93.4%
10TH GRADE
20.6/ 100
METRIC RATING
203rd/ 347
METRIC RANK
92.6%
10TH GRADE
0.4/ 100
METRIC RATING
264th/ 347
METRIC RANK
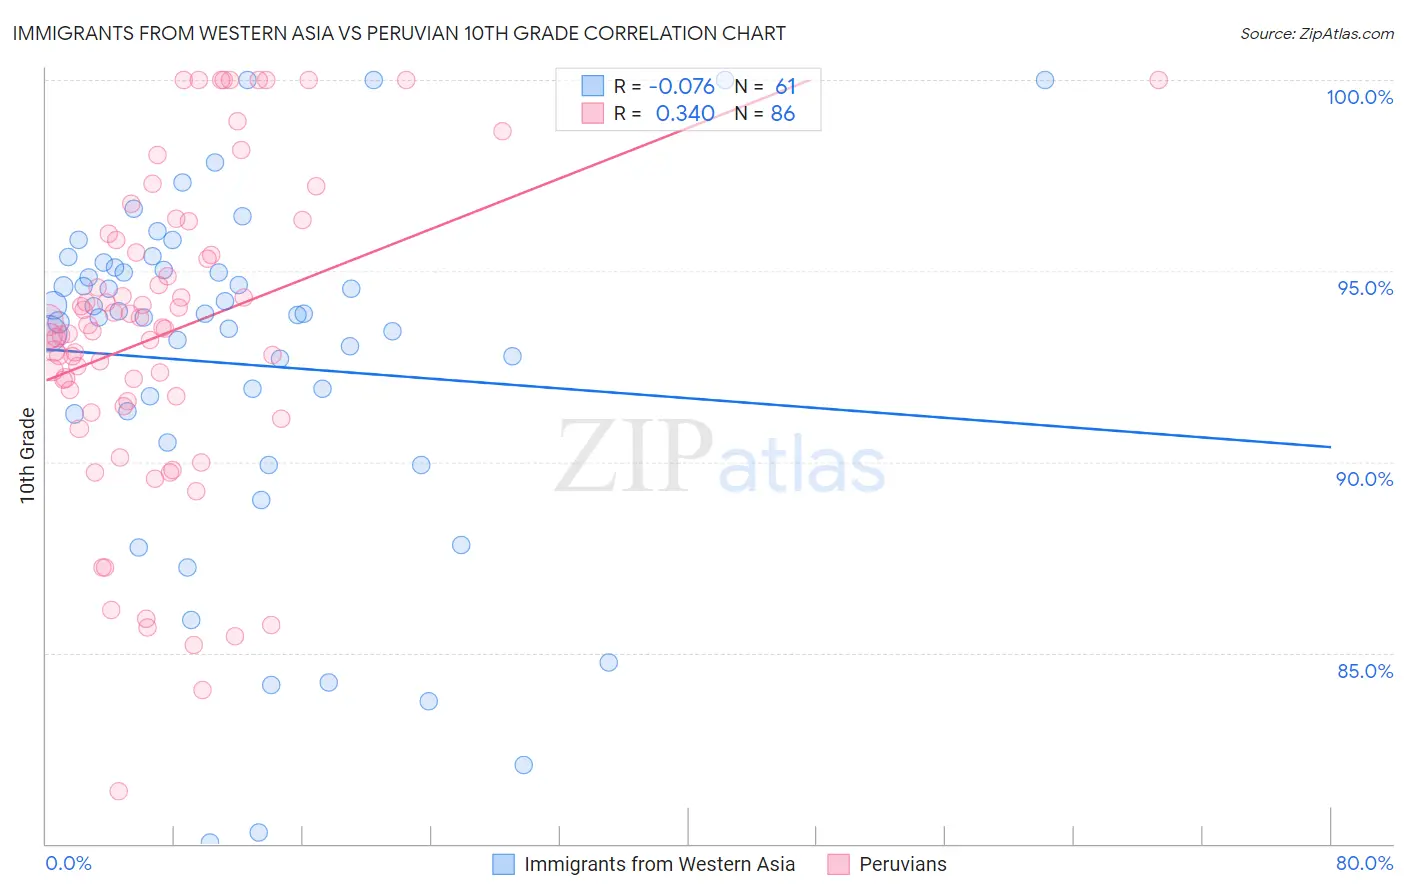
Immigrants from Western Asia vs Peruvian 10th Grade Correlation Chart
The statistical analysis conducted on geographies consisting of 404,433,811 people shows a slight negative correlation between the proportion of Immigrants from Western Asia and percentage of population with at least 10th grade education in the United States with a correlation coefficient (R) of -0.076 and weighted average of 93.4%. Similarly, the statistical analysis conducted on geographies consisting of 363,251,075 people shows a mild positive correlation between the proportion of Peruvians and percentage of population with at least 10th grade education in the United States with a correlation coefficient (R) of 0.340 and weighted average of 92.6%, a difference of 0.94%.
10th Grade Correlation Summary
| Measurement | Immigrants from Western Asia | Peruvian |
| Minimum | 80.0% | 81.4% |
| Maximum | 100.0% | 100.0% |
| Range | 20.0% | 18.6% |
| Mean | 92.6% | 93.4% |
| Median | 93.8% | 93.5% |
| Interquartile 25% (IQ1) | 90.9% | 91.6% |
| Interquartile 75% (IQ3) | 95.1% | 95.8% |
| Interquartile Range (IQR) | 4.2% | 4.2% |
| Standard Deviation (Sample) | 4.6% | 4.1% |
| Standard Deviation (Population) | 4.6% | 4.1% |
Similar Demographics by 10th Grade
Demographics Similar to Immigrants from Western Asia by 10th Grade
In terms of 10th grade, the demographic groups most similar to Immigrants from Western Asia are Ute (93.4%, a difference of 0.0%), Immigrants from Indonesia (93.4%, a difference of 0.0%), Immigrants from Uganda (93.5%, a difference of 0.010%), Immigrants from Sudan (93.4%, a difference of 0.010%), and Samoan (93.4%, a difference of 0.010%).
| Demographics | Rating | Rank | 10th Grade |
| Moroccans | 25.3 /100 | #196 | Fair 93.5% |
| Pueblo | 23.9 /100 | #197 | Fair 93.5% |
| Immigrants | Micronesia | 23.2 /100 | #198 | Fair 93.5% |
| Asians | 23.0 /100 | #199 | Fair 93.5% |
| Hopi | 22.2 /100 | #200 | Fair 93.5% |
| Hawaiians | 21.8 /100 | #201 | Fair 93.5% |
| Immigrants | Uganda | 20.9 /100 | #202 | Fair 93.5% |
| Immigrants | Western Asia | 20.6 /100 | #203 | Fair 93.4% |
| Ute | 20.3 /100 | #204 | Fair 93.4% |
| Immigrants | Indonesia | 20.2 /100 | #205 | Fair 93.4% |
| Immigrants | Sudan | 20.0 /100 | #206 | Fair 93.4% |
| Samoans | 19.5 /100 | #207 | Poor 93.4% |
| Immigrants | Syria | 19.4 /100 | #208 | Poor 93.4% |
| Immigrants | Chile | 18.8 /100 | #209 | Poor 93.4% |
| Indians (Asian) | 17.6 /100 | #210 | Poor 93.4% |
Demographics Similar to Peruvians by 10th Grade
In terms of 10th grade, the demographic groups most similar to Peruvians are Immigrants from South America (92.6%, a difference of 0.0%), Apache (92.6%, a difference of 0.0%), Paiute (92.6%, a difference of 0.010%), Dutch West Indian (92.6%, a difference of 0.030%), and Immigrants from Philippines (92.6%, a difference of 0.030%).
| Demographics | Rating | Rank | 10th Grade |
| U.S. Virgin Islanders | 0.7 /100 | #257 | Tragic 92.7% |
| Immigrants | Costa Rica | 0.6 /100 | #258 | Tragic 92.7% |
| Immigrants | Jamaica | 0.5 /100 | #259 | Tragic 92.6% |
| Immigrants | Uzbekistan | 0.5 /100 | #260 | Tragic 92.6% |
| Paiute | 0.4 /100 | #261 | Tragic 92.6% |
| Immigrants | South America | 0.4 /100 | #262 | Tragic 92.6% |
| Apache | 0.4 /100 | #263 | Tragic 92.6% |
| Peruvians | 0.4 /100 | #264 | Tragic 92.6% |
| Dutch West Indians | 0.4 /100 | #265 | Tragic 92.6% |
| Immigrants | Philippines | 0.4 /100 | #266 | Tragic 92.6% |
| Taiwanese | 0.3 /100 | #267 | Tragic 92.5% |
| Immigrants | Ghana | 0.3 /100 | #268 | Tragic 92.5% |
| Immigrants | Colombia | 0.3 /100 | #269 | Tragic 92.5% |
| Immigrants | Uruguay | 0.3 /100 | #270 | Tragic 92.5% |
| Immigrants | Eritrea | 0.3 /100 | #271 | Tragic 92.5% |