Immigrants from Ukraine vs Lebanese 10th Grade
COMPARE
Immigrants from Ukraine
Lebanese
10th Grade
10th Grade Comparison
Immigrants from Ukraine
Lebanese
94.0%
10TH GRADE
81.5/ 100
METRIC RATING
147th/ 347
METRIC RANK
94.6%
10TH GRADE
98.3/ 100
METRIC RATING
97th/ 347
METRIC RANK
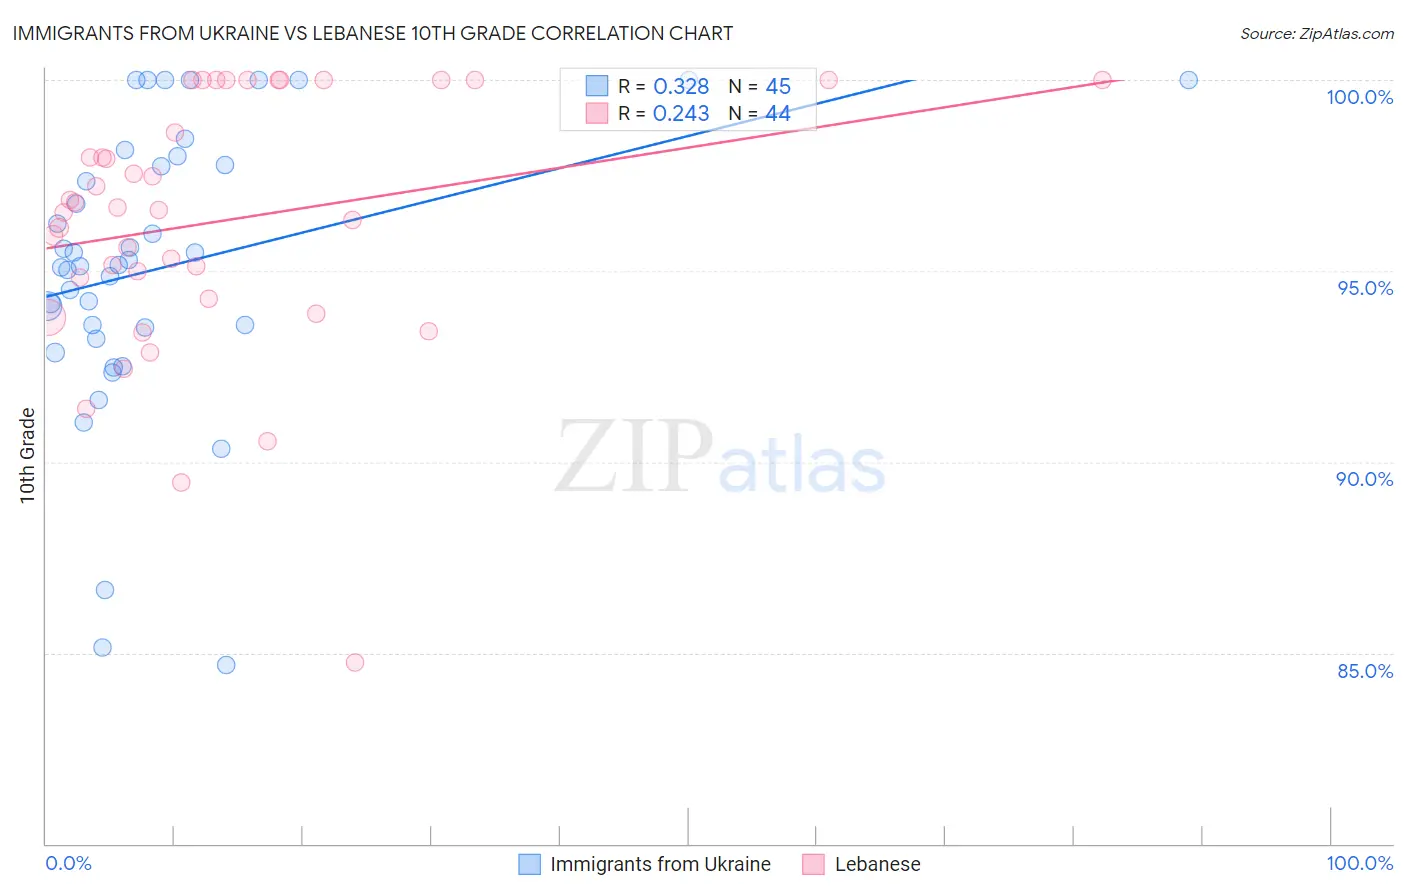
Immigrants from Ukraine vs Lebanese 10th Grade Correlation Chart
The statistical analysis conducted on geographies consisting of 289,714,613 people shows a mild positive correlation between the proportion of Immigrants from Ukraine and percentage of population with at least 10th grade education in the United States with a correlation coefficient (R) of 0.328 and weighted average of 94.0%. Similarly, the statistical analysis conducted on geographies consisting of 401,624,157 people shows a weak positive correlation between the proportion of Lebanese and percentage of population with at least 10th grade education in the United States with a correlation coefficient (R) of 0.243 and weighted average of 94.6%, a difference of 0.57%.
10th Grade Correlation Summary
| Measurement | Immigrants from Ukraine | Lebanese |
| Minimum | 84.7% | 84.7% |
| Maximum | 100.0% | 100.0% |
| Range | 15.3% | 15.3% |
| Mean | 95.1% | 96.3% |
| Median | 95.2% | 96.6% |
| Interquartile 25% (IQ1) | 93.4% | 94.5% |
| Interquartile 75% (IQ3) | 97.9% | 100.0% |
| Interquartile Range (IQR) | 4.5% | 5.5% |
| Standard Deviation (Sample) | 3.7% | 3.4% |
| Standard Deviation (Population) | 3.7% | 3.3% |
Similar Demographics by 10th Grade
Demographics Similar to Immigrants from Ukraine by 10th Grade
In terms of 10th grade, the demographic groups most similar to Immigrants from Ukraine are Arab (94.0%, a difference of 0.010%), Ugandan (94.0%, a difference of 0.010%), Chickasaw (94.1%, a difference of 0.020%), Egyptian (94.0%, a difference of 0.030%), and Kenyan (94.0%, a difference of 0.030%).
| Demographics | Rating | Rank | 10th Grade |
| Immigrants | Jordan | 87.6 /100 | #140 | Excellent 94.1% |
| Hmong | 86.6 /100 | #141 | Excellent 94.1% |
| Albanians | 86.5 /100 | #142 | Excellent 94.1% |
| Cherokee | 84.9 /100 | #143 | Excellent 94.1% |
| Immigrants | Kazakhstan | 84.9 /100 | #144 | Excellent 94.1% |
| Immigrants | Nonimmigrants | 83.8 /100 | #145 | Excellent 94.1% |
| Chickasaw | 82.6 /100 | #146 | Excellent 94.1% |
| Immigrants | Ukraine | 81.5 /100 | #147 | Excellent 94.0% |
| Arabs | 80.9 /100 | #148 | Excellent 94.0% |
| Ugandans | 80.7 /100 | #149 | Excellent 94.0% |
| Egyptians | 79.6 /100 | #150 | Good 94.0% |
| Kenyans | 79.1 /100 | #151 | Good 94.0% |
| Immigrants | Italy | 78.0 /100 | #152 | Good 94.0% |
| Immigrants | Brazil | 75.5 /100 | #153 | Good 94.0% |
| Immigrants | Kenya | 75.3 /100 | #154 | Good 94.0% |
Demographics Similar to Lebanese by 10th Grade
In terms of 10th grade, the demographic groups most similar to Lebanese are Menominee (94.6%, a difference of 0.0%), Immigrants from Switzerland (94.6%, a difference of 0.0%), Soviet Union (94.6%, a difference of 0.010%), Immigrants from Germany (94.6%, a difference of 0.010%), and Yugoslavian (94.6%, a difference of 0.020%).
| Demographics | Rating | Rank | 10th Grade |
| South Africans | 98.8 /100 | #90 | Exceptional 94.7% |
| Whites/Caucasians | 98.8 /100 | #91 | Exceptional 94.7% |
| Yugoslavians | 98.4 /100 | #92 | Exceptional 94.6% |
| Soviet Union | 98.3 /100 | #93 | Exceptional 94.6% |
| Immigrants | Germany | 98.3 /100 | #94 | Exceptional 94.6% |
| Menominee | 98.3 /100 | #95 | Exceptional 94.6% |
| Immigrants | Switzerland | 98.3 /100 | #96 | Exceptional 94.6% |
| Lebanese | 98.3 /100 | #97 | Exceptional 94.6% |
| Immigrants | Bulgaria | 98.1 /100 | #98 | Exceptional 94.6% |
| Immigrants | France | 97.9 /100 | #99 | Exceptional 94.5% |
| Immigrants | South Central Asia | 97.8 /100 | #100 | Exceptional 94.5% |
| Syrians | 97.7 /100 | #101 | Exceptional 94.5% |
| Cambodians | 97.6 /100 | #102 | Exceptional 94.5% |
| Immigrants | Europe | 97.5 /100 | #103 | Exceptional 94.5% |
| Immigrants | Romania | 97.5 /100 | #104 | Exceptional 94.5% |