Immigrants from Uganda vs Immigrants from Pakistan 4th Grade
COMPARE
Immigrants from Uganda
Immigrants from Pakistan
4th Grade
4th Grade Comparison
Immigrants from Uganda
Immigrants from Pakistan
97.4%
4TH GRADE
19.8/ 100
METRIC RATING
200th/ 347
METRIC RANK
97.2%
4TH GRADE
3.7/ 100
METRIC RATING
227th/ 347
METRIC RANK
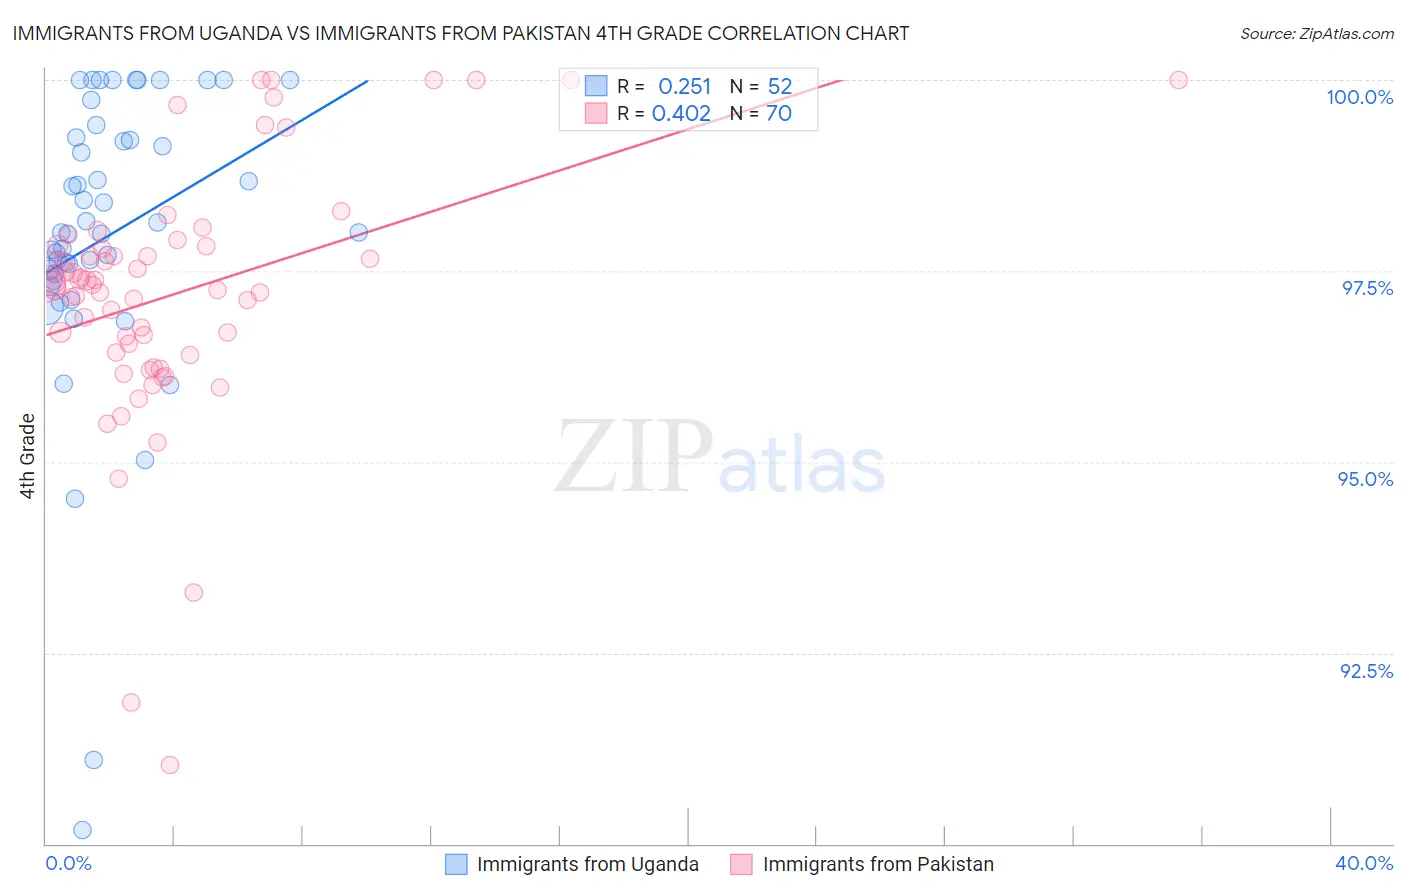
Immigrants from Uganda vs Immigrants from Pakistan 4th Grade Correlation Chart
The statistical analysis conducted on geographies consisting of 125,941,298 people shows a weak positive correlation between the proportion of Immigrants from Uganda and percentage of population with at least 4th grade education in the United States with a correlation coefficient (R) of 0.251 and weighted average of 97.4%. Similarly, the statistical analysis conducted on geographies consisting of 283,900,606 people shows a moderate positive correlation between the proportion of Immigrants from Pakistan and percentage of population with at least 4th grade education in the United States with a correlation coefficient (R) of 0.402 and weighted average of 97.2%, a difference of 0.18%.
4th Grade Correlation Summary
| Measurement | Immigrants from Uganda | Immigrants from Pakistan |
| Minimum | 90.2% | 91.0% |
| Maximum | 100.0% | 100.0% |
| Range | 9.8% | 9.0% |
| Mean | 98.0% | 97.2% |
| Median | 98.0% | 97.3% |
| Interquartile 25% (IQ1) | 97.4% | 96.4% |
| Interquartile 75% (IQ3) | 99.2% | 97.8% |
| Interquartile Range (IQR) | 1.8% | 1.4% |
| Standard Deviation (Sample) | 2.0% | 1.7% |
| Standard Deviation (Population) | 2.0% | 1.6% |
Similar Demographics by 4th Grade
Demographics Similar to Immigrants from Uganda by 4th Grade
In terms of 4th grade, the demographic groups most similar to Immigrants from Uganda are Native/Alaskan (97.4%, a difference of 0.010%), Guamanian/Chamorro (97.4%, a difference of 0.020%), Immigrants from Southern Europe (97.4%, a difference of 0.020%), Immigrants from Chile (97.4%, a difference of 0.020%), and Hawaiian (97.4%, a difference of 0.030%).
| Demographics | Rating | Rank | 4th Grade |
| Immigrants | Egypt | 30.1 /100 | #193 | Fair 97.4% |
| Portuguese | 29.2 /100 | #194 | Fair 97.4% |
| Paraguayans | 28.9 /100 | #195 | Fair 97.4% |
| Immigrants | Albania | 27.7 /100 | #196 | Fair 97.4% |
| Hawaiians | 25.6 /100 | #197 | Fair 97.4% |
| Guamanians/Chamorros | 23.0 /100 | #198 | Fair 97.4% |
| Natives/Alaskans | 20.6 /100 | #199 | Fair 97.4% |
| Immigrants | Uganda | 19.8 /100 | #200 | Poor 97.4% |
| Immigrants | Southern Europe | 16.2 /100 | #201 | Poor 97.4% |
| Immigrants | Chile | 16.1 /100 | #202 | Poor 97.4% |
| Immigrants | Northern Africa | 15.1 /100 | #203 | Poor 97.4% |
| Africans | 14.6 /100 | #204 | Poor 97.4% |
| Paiute | 13.2 /100 | #205 | Poor 97.3% |
| Immigrants | Zaire | 12.8 /100 | #206 | Poor 97.3% |
| Moroccans | 11.3 /100 | #207 | Poor 97.3% |
Demographics Similar to Immigrants from Pakistan by 4th Grade
In terms of 4th grade, the demographic groups most similar to Immigrants from Pakistan are Bahamian (97.2%, a difference of 0.0%), Subsaharan African (97.2%, a difference of 0.0%), Liberian (97.2%, a difference of 0.0%), Uruguayan (97.2%, a difference of 0.010%), and Immigrants from Malaysia (97.2%, a difference of 0.010%).
| Demographics | Rating | Rank | 4th Grade |
| South American Indians | 5.5 /100 | #220 | Tragic 97.3% |
| Immigrants | Panama | 5.4 /100 | #221 | Tragic 97.3% |
| Immigrants | Lebanon | 5.1 /100 | #222 | Tragic 97.3% |
| Immigrants | Sudan | 5.0 /100 | #223 | Tragic 97.2% |
| Immigrants | Syria | 5.0 /100 | #224 | Tragic 97.2% |
| Immigrants | Iraq | 4.6 /100 | #225 | Tragic 97.2% |
| Bahamians | 3.8 /100 | #226 | Tragic 97.2% |
| Immigrants | Pakistan | 3.7 /100 | #227 | Tragic 97.2% |
| Sub-Saharan Africans | 3.6 /100 | #228 | Tragic 97.2% |
| Liberians | 3.6 /100 | #229 | Tragic 97.2% |
| Uruguayans | 3.5 /100 | #230 | Tragic 97.2% |
| Immigrants | Malaysia | 3.4 /100 | #231 | Tragic 97.2% |
| Immigrants | Western Asia | 3.4 /100 | #232 | Tragic 97.2% |
| Senegalese | 3.1 /100 | #233 | Tragic 97.2% |
| Assyrians/Chaldeans/Syriacs | 3.0 /100 | #234 | Tragic 97.2% |