Immigrants from Trinidad and Tobago vs Immigrants from Turkey 2nd Grade

COMPARE

Immigrants from Trinidad and Tobago
Race
Ancestry
AfghanAfricanAlaska NativeAlaskan AthabascanAlbanianAleutAlsatianAmericanApacheArabArapahoArgentineanArmenianAssyrian/Chaldean/SyriacAustralianAustrianBahamianBangladeshiBarbadianBasqueBelgianBelizeanBermudanBhutaneseBlackfeetBolivianBrazilianBritishBritish West IndianBulgarianBurmeseCajunCambodianCanadianCape VerdeanCarpatho RusynCelticCentral AmericanCentral American IndianCherokeeCheyenneChickasawChileanChineseChippewaChoctawColombianColvilleComancheCosta RicanCreeCreekCroatianCrowCubanCypriotCzechCzechoslovakianDanishDelawareDominicanDutchDutch West IndianEastern EuropeanEcuadorianEgyptianEnglishEstonianEthiopianEuropeanFijianFilipinoFinnishFrenchFrench American IndianFrench CanadianGermanGerman RussianGhanaianGreekGuamanian/ChamorroGuatemalanGuyaneseHaitianHmongHonduranHopiHoumaHungarianIcelanderIndian (Asian)IndonesianInupiatIranianIraqiIrishIroquoisIsraeliItalianJamaicanJapaneseJordanianKenyanKiowaKoreanLaotianLatvianLebaneseLiberianLithuanianLumbeeLuxembourgerMacedonianMalaysianMalteseMarshalleseMenomineeMexicanMexican American IndianMongolianMoroccanNative HawaiianNavajoNepaleseNew ZealanderNicaraguanNigerianNorthern EuropeanNorwegianOkinawanOsageOttawaPaiutePakistaniPalestinianPanamanianParaguayanPennsylvania GermanPeruvianPimaPolishPortuguesePotawatomiPuebloPuerto RicanPuget Sound SalishRomanianRussianSalvadoranSamoanScandinavianScotch-IrishScottishSeminoleSenegaleseSerbianShoshoneSierra LeoneanSiouxSlavicSlovakSloveneSomaliSouth AfricanSouth AmericanSouth American IndianSoviet UnionSpaniardSpanishSpanish AmericanSpanish American IndianSri LankanSubsaharan AfricanSudaneseSwedishSwissSyrianTaiwaneseThaiTlingit-HaidaTohono O'OdhamTonganTrinidadian and TobagonianTsimshianTurkishU.S. Virgin IslanderUgandanUkrainianUruguayanUteVenezuelanVietnameseWelshWest IndianYakamaYaquiYugoslavianYumanYup'ikZimbabwean
Immigration
NonimmigrantsImmigrantsAfghanistanAfricaAlbaniaArgentinaArmeniaAsiaAustraliaAustriaBahamasBangladeshBarbadosBelarusBelgiumBelizeBoliviaBosnia and HerzegovinaBrazilBulgariaBurma/MyanmarCabo VerdeCambodiaCameroonCanadaCaribbeanCentral AmericaChileChinaColombiaCongoCosta RicaCroatiaCubaCzechoslovakiaDenmarkDominicaDominican RepublicEastern AfricaEastern AsiaEastern EuropeEcuadorEgyptEl SalvadorEnglandEritreaEthiopiaEuropeFijiFranceGermanyGhanaGreeceGrenadaGuatemalaGuyanaHaitiHondurasHong KongHungaryIndiaIndonesiaIranIraqIrelandIsraelItalyJamaicaJapanJordanKazakhstanKenyaKoreaKuwaitLaosLatin AmericaLatviaLebanonLiberiaLithuaniaMalaysiaMexicoMicronesiaMiddle AfricaMoldovaMoroccoNepalNetherlandsNicaraguaNigeriaNorth AmericaNorth MacedoniaNorthern AfricaNorthern EuropeNorwayOceaniaPakistanPanamaPeruPhilippinesPolandPortugalRomaniaRussiaSaudi ArabiaScotlandSenegalSerbiaSierra LeoneSingaporeSomaliaSouth AfricaSouth AmericaSouth Central AsiaSouth Eastern AsiaSouthern EuropeSpainSri LankaSt. Vincent and the GrenadinesSudanSwedenSwitzerlandSyriaTaiwanThailandTrinidad and TobagoUgandaUkraineUruguayUzbekistanVenezuelaVietnamWest IndiesWestern AfricaWestern AsiaWestern EuropeYemenZaireZimbabweAzores
Immigrants from Turkey
Race
Ancestry
AfghanAfricanAlaska NativeAlaskan AthabascanAlbanianAleutAlsatianAmericanApacheArabArapahoArgentineanArmenianAssyrian/Chaldean/SyriacAustralianAustrianBahamianBangladeshiBarbadianBasqueBelgianBelizeanBermudanBhutaneseBlackfeetBolivianBrazilianBritishBritish West IndianBulgarianBurmeseCajunCambodianCanadianCape VerdeanCarpatho RusynCelticCentral AmericanCentral American IndianCherokeeCheyenneChickasawChileanChineseChippewaChoctawColombianColvilleComancheCosta RicanCreeCreekCroatianCrowCubanCypriotCzechCzechoslovakianDanishDelawareDominicanDutchDutch West IndianEastern EuropeanEcuadorianEgyptianEnglishEstonianEthiopianEuropeanFijianFilipinoFinnishFrenchFrench American IndianFrench CanadianGermanGerman RussianGhanaianGreekGuamanian/ChamorroGuatemalanGuyaneseHaitianHmongHonduranHopiHoumaHungarianIcelanderIndian (Asian)IndonesianInupiatIranianIraqiIrishIroquoisIsraeliItalianJamaicanJapaneseJordanianKenyanKiowaKoreanLaotianLatvianLebaneseLiberianLithuanianLumbeeLuxembourgerMacedonianMalaysianMalteseMarshalleseMenomineeMexicanMexican American IndianMongolianMoroccanNative HawaiianNavajoNepaleseNew ZealanderNicaraguanNigerianNorthern EuropeanNorwegianOkinawanOsageOttawaPaiutePakistaniPalestinianPanamanianParaguayanPennsylvania GermanPeruvianPimaPolishPortuguesePotawatomiPuebloPuerto RicanPuget Sound SalishRomanianRussianSalvadoranSamoanScandinavianScotch-IrishScottishSeminoleSenegaleseSerbianShoshoneSierra LeoneanSiouxSlavicSlovakSloveneSomaliSouth AfricanSouth AmericanSouth American IndianSoviet UnionSpaniardSpanishSpanish AmericanSpanish American IndianSri LankanSubsaharan AfricanSudaneseSwedishSwissSyrianTaiwaneseThaiTlingit-HaidaTohono O'OdhamTonganTrinidadian and TobagonianTsimshianTurkishU.S. Virgin IslanderUgandanUkrainianUruguayanUteVenezuelanVietnameseWelshWest IndianYakamaYaquiYugoslavianYumanYup'ikZimbabwean
Immigration
NonimmigrantsImmigrantsAfghanistanAfricaAlbaniaArgentinaArmeniaAsiaAustraliaAustriaBahamasBangladeshBarbadosBelarusBelgiumBelizeBoliviaBosnia and HerzegovinaBrazilBulgariaBurma/MyanmarCabo VerdeCambodiaCameroonCanadaCaribbeanCentral AmericaChileChinaColombiaCongoCosta RicaCroatiaCubaCzechoslovakiaDenmarkDominicaDominican RepublicEastern AfricaEastern AsiaEastern EuropeEcuadorEgyptEl SalvadorEnglandEritreaEthiopiaEuropeFijiFranceGermanyGhanaGreeceGrenadaGuatemalaGuyanaHaitiHondurasHong KongHungaryIndiaIndonesiaIranIraqIrelandIsraelItalyJamaicaJapanJordanKazakhstanKenyaKoreaKuwaitLaosLatin AmericaLatviaLebanonLiberiaLithuaniaMalaysiaMexicoMicronesiaMiddle AfricaMoldovaMoroccoNepalNetherlandsNicaraguaNigeriaNorth AmericaNorth MacedoniaNorthern AfricaNorthern EuropeNorwayOceaniaPakistanPanamaPeruPhilippinesPolandPortugalRomaniaRussiaSaudi ArabiaScotlandSenegalSerbiaSierra LeoneSingaporeSomaliaSouth AfricaSouth AmericaSouth Central AsiaSouth Eastern AsiaSouthern EuropeSpainSri LankaSt. Vincent and the GrenadinesSudanSwedenSwitzerlandSyriaTaiwanThailandTurkeyUgandaUkraineUruguayUzbekistanVenezuelaVietnamWest IndiesWestern AfricaWestern AsiaWestern EuropeYemenZaireZimbabweAzores
2nd Grade
Income
Poverty
Unemployment
Labor Participation
Family Structure
Vehicle Availability
Education Level
Disability

2nd Grade Comparison

Immigrants from Trinidad and Tobago

Immigrants from Turkey

Tragic
Excellent
97.2%
2ND GRADE
0.0/ 100
METRIC RATING
283rd/ 347
METRIC RANK
98.0%
2ND GRADE
83.0/ 100
METRIC RATING
141st/ 347
METRIC RANK

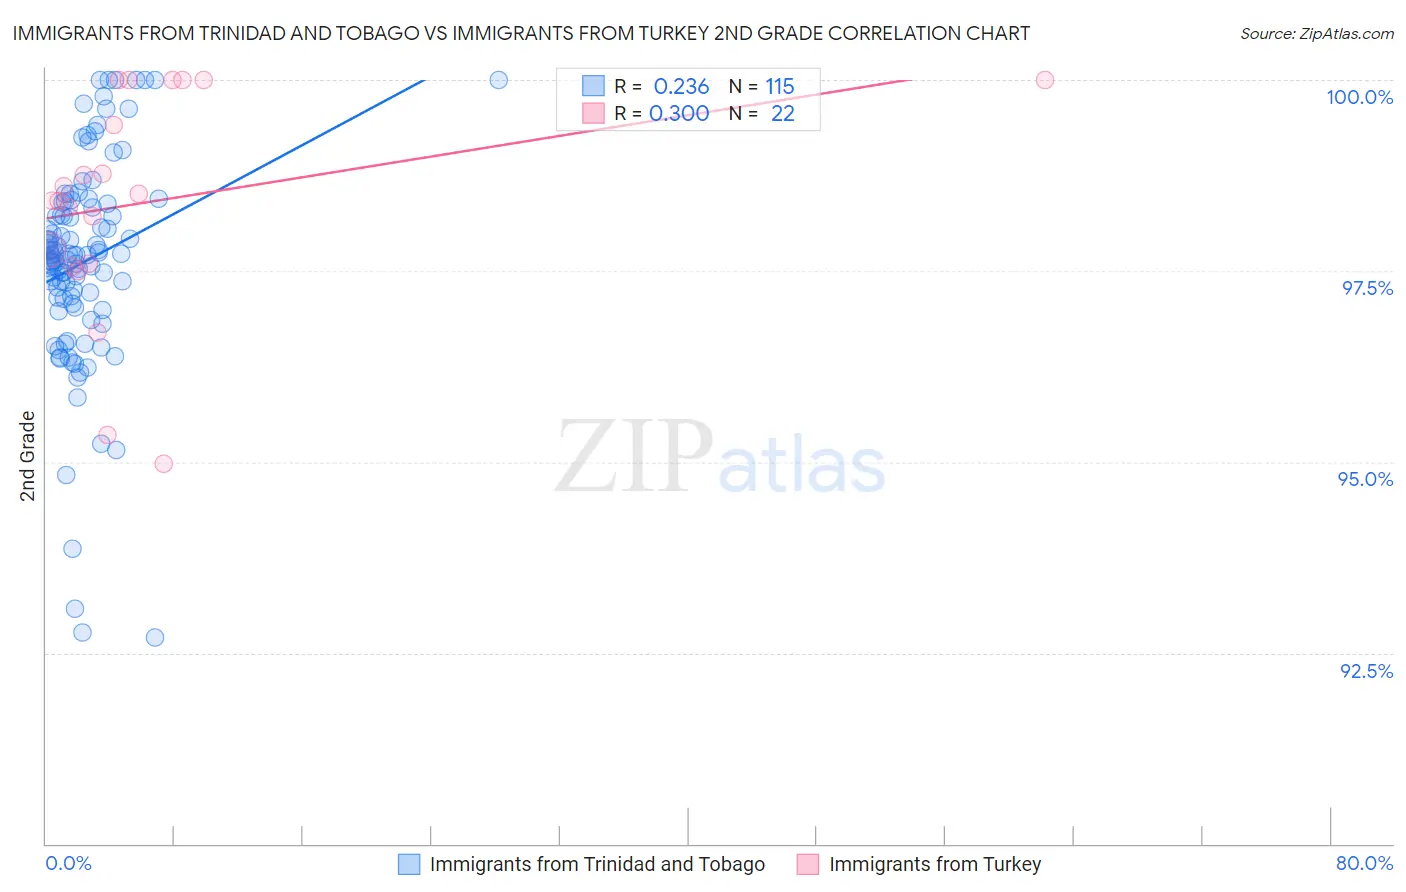
Immigrants from Trinidad and Tobago vs Immigrants from Turkey 2nd Grade Correlation Chart

The statistical analysis conducted on geographies consisting of 223,545,304 people shows a weak positive correlation between the proportion of Immigrants from Trinidad and Tobago and percentage of population with at least 2nd grade education in the United States with a correlation coefficient (R) of 0.236 and weighted average of 97.2%. Similarly, the statistical analysis conducted on geographies consisting of 223,057,877 people shows a mild positive correlation between the proportion of Immigrants from Turkey and percentage of population with at least 2nd grade education in the United States with a correlation coefficient (R) of 0.300 and weighted average of 98.0%, a difference of 0.77%.
Immigrants from Trinidad and Tobago vs Immigrants from Turkey 2nd Grade

2nd Grade Correlation Summary

MeasurementImmigrants from Trinidad and TobagoImmigrants from Turkey
Minimum92.7%95.0%
Maximum100.0%100.0%
Range7.3%5.0%
Mean97.6%98.4%
Median97.7%98.5%
Interquartile 25% (IQ1)97.1%97.6%
Interquartile 75% (IQ3)98.4%100.0%
Interquartile Range (IQR)1.3%2.4%
Standard Deviation (Sample)1.4%1.4%
Standard Deviation (Population)1.4%1.4%

Similar Demographics by 2nd Grade

Demographics Similar to Immigrants from Trinidad and Tobago by 2nd Grade

In terms of 2nd grade, the demographic groups most similar to Immigrants from Trinidad and Tobago are Immigrants from West Indies (97.2%, a difference of 0.010%), Immigrants from Hong Kong (97.2%, a difference of 0.020%), Immigrants from Barbados (97.2%, a difference of 0.020%), Immigrants from Portugal (97.2%, a difference of 0.020%), and Immigrants from Thailand (97.2%, a difference of 0.030%).
DemographicsRating | Rank2nd Grade
Immigrants | Philippines
0.1
/100
|
#276
Tragic
97.3%
Immigrants | Western Africa
0.1
/100
|
#277
Tragic
97.3%
Immigrants | Uzbekistan
0.1
/100
|
#278
Tragic
97.3%
Immigrants | Ghana
0.1
/100
|
#279
Tragic
97.3%
Afghans
0.1
/100
|
#280
Tragic
97.3%
Trinidadians and Tobagonians
0.1
/100
|
#281
Tragic
97.3%
Barbadians
0.1
/100
|
#282
Tragic
97.3%
Immigrants | Trinidad and Tobago
0.0
/100
|
#283
Tragic
97.2%
Immigrants | West Indies
0.0
/100
|
#284
Tragic
97.2%
Immigrants | Hong Kong
0.0
/100
|
#285
Tragic
97.2%
Immigrants | Barbados
0.0
/100
|
#286
Tragic
97.2%
Immigrants | Portugal
0.0
/100
|
#287
Tragic
97.2%
Immigrants | Thailand
0.0
/100
|
#288
Tragic
97.2%
Houma
0.0
/100
|
#289
Tragic
97.2%
Immigrants | St. Vincent and the Grenadines
0.0
/100
|
#290
Tragic
97.2%

Demographics Similar to Immigrants from Turkey by 2nd Grade

In terms of 2nd grade, the demographic groups most similar to Immigrants from Turkey are Palestinian (98.0%, a difference of 0.010%), Burmese (98.0%, a difference of 0.010%), Alsatian (98.0%, a difference of 0.010%), Hmong (98.0%, a difference of 0.020%), and Filipino (98.0%, a difference of 0.020%).
DemographicsRating | Rank2nd Grade
Immigrants | Hungary
89.7
/100
|
#134
Excellent
98.0%
Immigrants | Bulgaria
89.7
/100
|
#135
Excellent
98.0%
Immigrants | Kuwait
89.2
/100
|
#136
Excellent
98.0%
Immigrants | Romania
88.3
/100
|
#137
Excellent
98.0%
Israelis
87.9
/100
|
#138
Excellent
98.0%
Blackfeet
87.5
/100
|
#139
Excellent
98.0%
Palestinians
83.9
/100
|
#140
Excellent
98.0%
Immigrants | Turkey
83.0
/100
|
#141
Excellent
98.0%
Burmese
81.0
/100
|
#142
Excellent
98.0%
Alsatians
80.5
/100
|
#143
Excellent
98.0%
Hmong
80.0
/100
|
#144
Good
98.0%
Filipinos
79.2
/100
|
#145
Good
98.0%
Immigrants | Israel
78.0
/100
|
#146
Good
98.0%
Immigrants | Greece
76.8
/100
|
#147
Good
98.0%
Jordanians
74.5
/100
|
#148
Good
98.0%