Hispanic or Latino vs Immigrants from Turkey 2nd Grade
COMPARE
Hispanic or Latino
Immigrants from Turkey
2nd Grade
2nd Grade Comparison
Hispanics or Latinos
Immigrants from Turkey
96.8%
2ND GRADE
0.0/ 100
METRIC RATING
313th/ 347
METRIC RANK
98.0%
2ND GRADE
83.0/ 100
METRIC RATING
141st/ 347
METRIC RANK
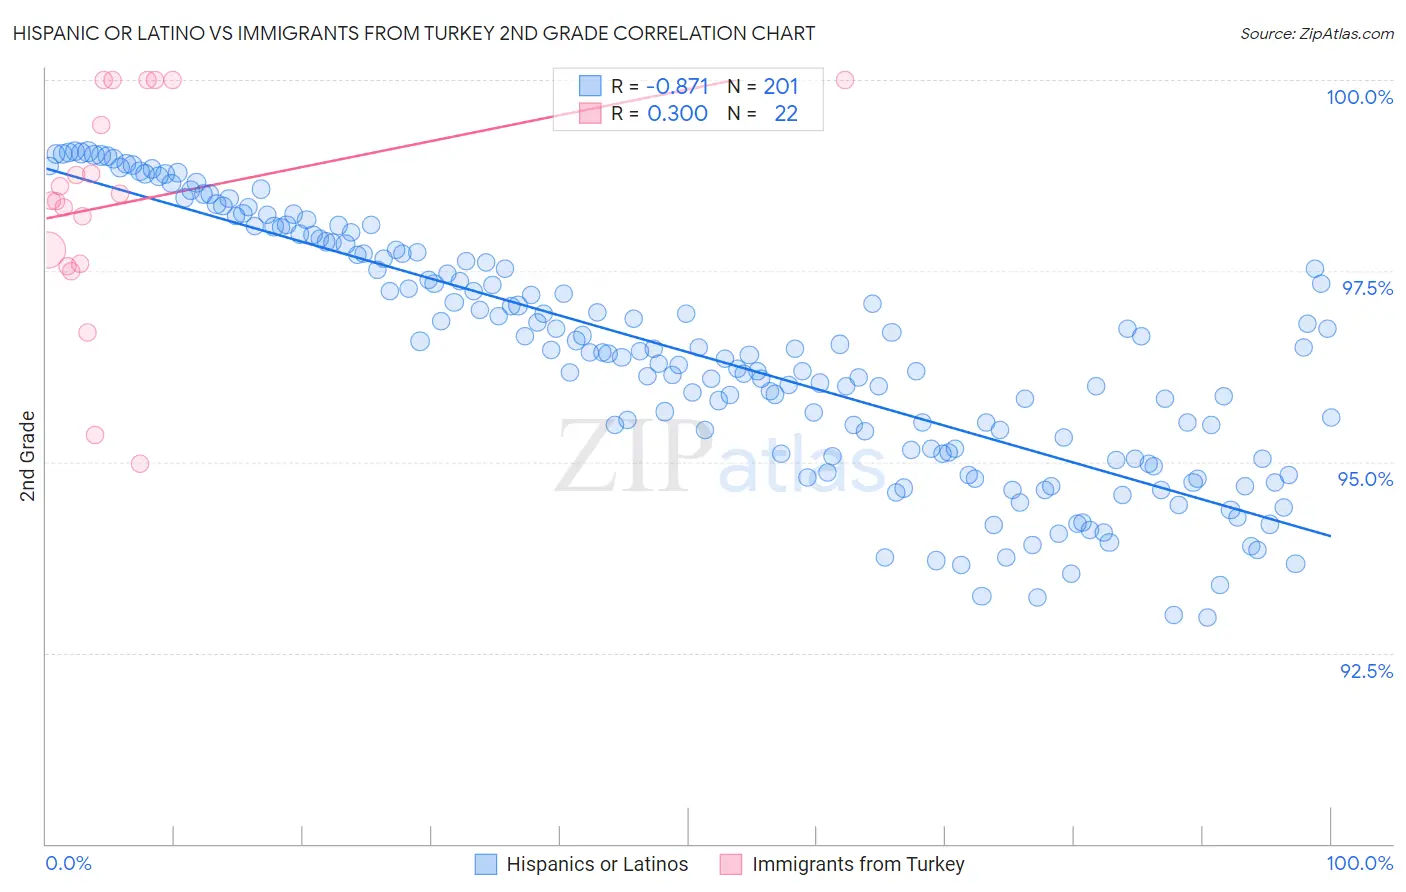
Hispanic or Latino vs Immigrants from Turkey 2nd Grade Correlation Chart
The statistical analysis conducted on geographies consisting of 578,615,396 people shows a very strong negative correlation between the proportion of Hispanics or Latinos and percentage of population with at least 2nd grade education in the United States with a correlation coefficient (R) of -0.871 and weighted average of 96.8%. Similarly, the statistical analysis conducted on geographies consisting of 223,057,877 people shows a mild positive correlation between the proportion of Immigrants from Turkey and percentage of population with at least 2nd grade education in the United States with a correlation coefficient (R) of 0.300 and weighted average of 98.0%, a difference of 1.2%.
2nd Grade Correlation Summary
| Measurement | Hispanic or Latino | Immigrants from Turkey |
| Minimum | 93.0% | 95.0% |
| Maximum | 99.1% | 100.0% |
| Range | 6.1% | 5.0% |
| Mean | 96.4% | 98.4% |
| Median | 96.4% | 98.5% |
| Interquartile 25% (IQ1) | 95.1% | 97.6% |
| Interquartile 75% (IQ3) | 97.8% | 100.0% |
| Interquartile Range (IQR) | 2.6% | 2.4% |
| Standard Deviation (Sample) | 1.6% | 1.4% |
| Standard Deviation (Population) | 1.6% | 1.4% |
Similar Demographics by 2nd Grade
Demographics Similar to Hispanics or Latinos by 2nd Grade
In terms of 2nd grade, the demographic groups most similar to Hispanics or Latinos are Cape Verdean (96.8%, a difference of 0.020%), Sri Lankan (96.8%, a difference of 0.030%), Guyanese (96.8%, a difference of 0.030%), Immigrants from Ecuador (96.8%, a difference of 0.030%), and Immigrants from Haiti (96.8%, a difference of 0.040%).
| Demographics | Rating | Rank | 2nd Grade |
| Immigrants | Somalia | 0.0 /100 | #306 | Tragic 96.9% |
| Immigrants | Azores | 0.0 /100 | #307 | Tragic 96.8% |
| Immigrants | Haiti | 0.0 /100 | #308 | Tragic 96.8% |
| Belizeans | 0.0 /100 | #309 | Tragic 96.8% |
| Sri Lankans | 0.0 /100 | #310 | Tragic 96.8% |
| Guyanese | 0.0 /100 | #311 | Tragic 96.8% |
| Cape Verdeans | 0.0 /100 | #312 | Tragic 96.8% |
| Hispanics or Latinos | 0.0 /100 | #313 | Tragic 96.8% |
| Immigrants | Ecuador | 0.0 /100 | #314 | Tragic 96.8% |
| Immigrants | Belize | 0.0 /100 | #315 | Tragic 96.8% |
| Hondurans | 0.0 /100 | #316 | Tragic 96.7% |
| Immigrants | Laos | 0.0 /100 | #317 | Tragic 96.7% |
| Indonesians | 0.0 /100 | #318 | Tragic 96.7% |
| Immigrants | Nicaragua | 0.0 /100 | #319 | Tragic 96.7% |
| Immigrants | Guyana | 0.0 /100 | #320 | Tragic 96.7% |
Demographics Similar to Immigrants from Turkey by 2nd Grade
In terms of 2nd grade, the demographic groups most similar to Immigrants from Turkey are Palestinian (98.0%, a difference of 0.010%), Burmese (98.0%, a difference of 0.010%), Alsatian (98.0%, a difference of 0.010%), Hmong (98.0%, a difference of 0.020%), and Filipino (98.0%, a difference of 0.020%).
| Demographics | Rating | Rank | 2nd Grade |
| Immigrants | Hungary | 89.7 /100 | #134 | Excellent 98.0% |
| Immigrants | Bulgaria | 89.7 /100 | #135 | Excellent 98.0% |
| Immigrants | Kuwait | 89.2 /100 | #136 | Excellent 98.0% |
| Immigrants | Romania | 88.3 /100 | #137 | Excellent 98.0% |
| Israelis | 87.9 /100 | #138 | Excellent 98.0% |
| Blackfeet | 87.5 /100 | #139 | Excellent 98.0% |
| Palestinians | 83.9 /100 | #140 | Excellent 98.0% |
| Immigrants | Turkey | 83.0 /100 | #141 | Excellent 98.0% |
| Burmese | 81.0 /100 | #142 | Excellent 98.0% |
| Alsatians | 80.5 /100 | #143 | Excellent 98.0% |
| Hmong | 80.0 /100 | #144 | Good 98.0% |
| Filipinos | 79.2 /100 | #145 | Good 98.0% |
| Immigrants | Israel | 78.0 /100 | #146 | Good 98.0% |
| Immigrants | Greece | 76.8 /100 | #147 | Good 98.0% |
| Jordanians | 74.5 /100 | #148 | Good 98.0% |