Immigrants from Saudi Arabia vs Immigrants from Turkey 2nd Grade
COMPARE
Immigrants from Saudi Arabia
Immigrants from Turkey
2nd Grade
2nd Grade Comparison
Immigrants from Saudi Arabia
Immigrants from Turkey
98.1%
2ND GRADE
93.6/ 100
METRIC RATING
127th/ 347
METRIC RANK
98.0%
2ND GRADE
83.0/ 100
METRIC RATING
141st/ 347
METRIC RANK
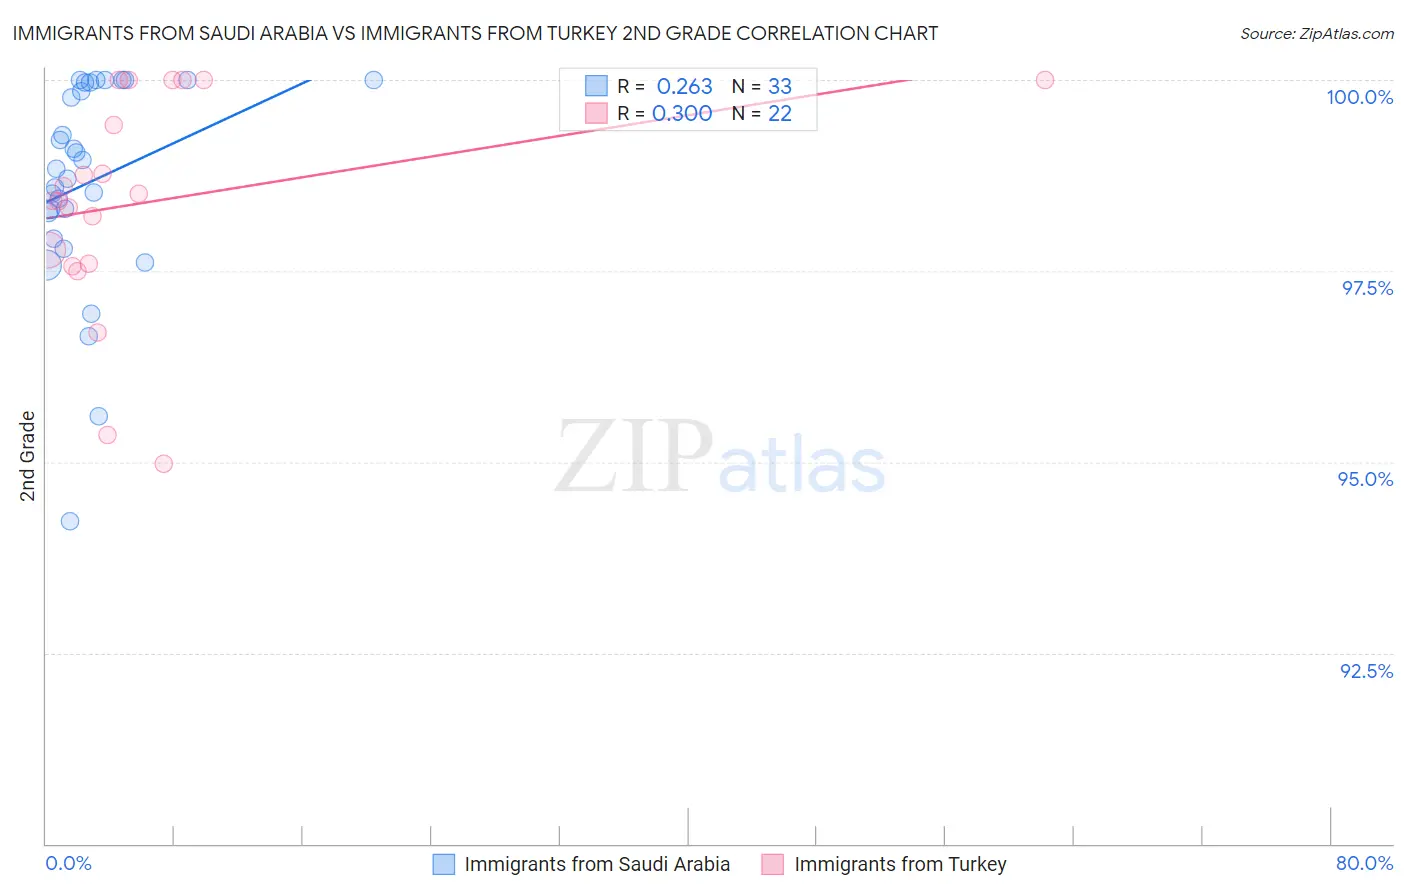
Immigrants from Saudi Arabia vs Immigrants from Turkey 2nd Grade Correlation Chart
The statistical analysis conducted on geographies consisting of 164,277,573 people shows a weak positive correlation between the proportion of Immigrants from Saudi Arabia and percentage of population with at least 2nd grade education in the United States with a correlation coefficient (R) of 0.263 and weighted average of 98.1%. Similarly, the statistical analysis conducted on geographies consisting of 223,057,877 people shows a mild positive correlation between the proportion of Immigrants from Turkey and percentage of population with at least 2nd grade education in the United States with a correlation coefficient (R) of 0.300 and weighted average of 98.0%, a difference of 0.090%.
2nd Grade Correlation Summary
| Measurement | Immigrants from Saudi Arabia | Immigrants from Turkey |
| Minimum | 94.2% | 95.0% |
| Maximum | 100.0% | 100.0% |
| Range | 5.8% | 5.0% |
| Mean | 98.7% | 98.4% |
| Median | 98.8% | 98.5% |
| Interquartile 25% (IQ1) | 98.1% | 97.6% |
| Interquartile 75% (IQ3) | 100.0% | 100.0% |
| Interquartile Range (IQR) | 1.9% | 2.4% |
| Standard Deviation (Sample) | 1.4% | 1.4% |
| Standard Deviation (Population) | 1.3% | 1.4% |
Demographics Similar to Immigrants from Saudi Arabia and Immigrants from Turkey by 2nd Grade
In terms of 2nd grade, the demographic groups most similar to Immigrants from Saudi Arabia are Menominee (98.1%, a difference of 0.010%), Iroquois (98.1%, a difference of 0.010%), Syrian (98.1%, a difference of 0.010%), Immigrants from Serbia (98.1%, a difference of 0.020%), and Immigrants from Croatia (98.1%, a difference of 0.020%). Similarly, the demographic groups most similar to Immigrants from Turkey are Palestinian (98.0%, a difference of 0.010%), Burmese (98.0%, a difference of 0.010%), Alsatian (98.0%, a difference of 0.010%), Hmong (98.0%, a difference of 0.020%), and Immigrants from Romania (98.0%, a difference of 0.030%).
| Demographics | Rating | Rank | 2nd Grade |
| Menominee | 94.1 /100 | #124 | Exceptional 98.1% |
| Iroquois | 94.1 /100 | #125 | Exceptional 98.1% |
| Syrians | 94.0 /100 | #126 | Exceptional 98.1% |
| Immigrants | Saudi Arabia | 93.6 /100 | #127 | Exceptional 98.1% |
| Immigrants | Serbia | 92.3 /100 | #128 | Exceptional 98.1% |
| Immigrants | Croatia | 92.1 /100 | #129 | Exceptional 98.1% |
| Seminole | 91.1 /100 | #130 | Exceptional 98.0% |
| Immigrants | Europe | 91.1 /100 | #131 | Exceptional 98.0% |
| Spaniards | 90.7 /100 | #132 | Exceptional 98.0% |
| Cambodians | 90.7 /100 | #133 | Exceptional 98.0% |
| Immigrants | Hungary | 89.7 /100 | #134 | Excellent 98.0% |
| Immigrants | Bulgaria | 89.7 /100 | #135 | Excellent 98.0% |
| Immigrants | Kuwait | 89.2 /100 | #136 | Excellent 98.0% |
| Immigrants | Romania | 88.3 /100 | #137 | Excellent 98.0% |
| Israelis | 87.9 /100 | #138 | Excellent 98.0% |
| Blackfeet | 87.5 /100 | #139 | Excellent 98.0% |
| Palestinians | 83.9 /100 | #140 | Excellent 98.0% |
| Immigrants | Turkey | 83.0 /100 | #141 | Excellent 98.0% |
| Burmese | 81.0 /100 | #142 | Excellent 98.0% |
| Alsatians | 80.5 /100 | #143 | Excellent 98.0% |
| Hmong | 80.0 /100 | #144 | Good 98.0% |