Uruguayan vs American Doctorate Degree
COMPARE
Uruguayan
American
Doctorate Degree
Doctorate Degree Comparison
Uruguayans
Americans
1.8%
DOCTORATE DEGREE
26.2/ 100
METRIC RATING
194th/ 347
METRIC RANK
1.5%
DOCTORATE DEGREE
1.0/ 100
METRIC RATING
253rd/ 347
METRIC RANK
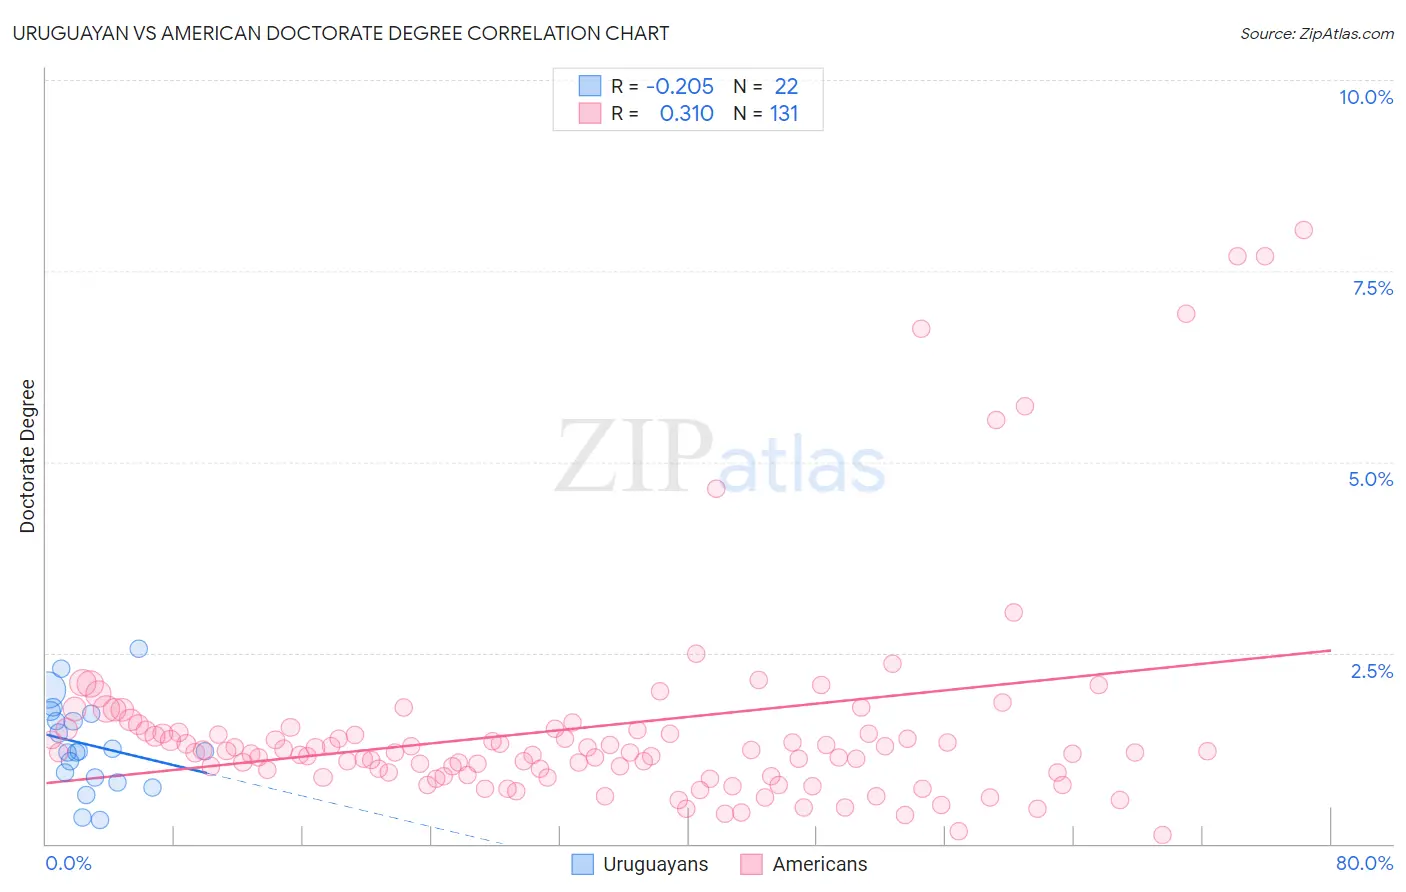
Uruguayan vs American Doctorate Degree Correlation Chart
The statistical analysis conducted on geographies consisting of 144,575,670 people shows a weak negative correlation between the proportion of Uruguayans and percentage of population with at least doctorate degree education in the United States with a correlation coefficient (R) of -0.205 and weighted average of 1.8%. Similarly, the statistical analysis conducted on geographies consisting of 552,800,841 people shows a mild positive correlation between the proportion of Americans and percentage of population with at least doctorate degree education in the United States with a correlation coefficient (R) of 0.310 and weighted average of 1.5%, a difference of 15.6%.
Doctorate Degree Correlation Summary
| Measurement | Uruguayan | American |
| Minimum | 0.31% | 0.12% |
| Maximum | 2.6% | 8.0% |
| Range | 2.2% | 7.9% |
| Mean | 1.3% | 1.5% |
| Median | 1.2% | 1.2% |
| Interquartile 25% (IQ1) | 0.86% | 0.90% |
| Interquartile 75% (IQ3) | 1.7% | 1.5% |
| Interquartile Range (IQR) | 0.84% | 0.58% |
| Standard Deviation (Sample) | 0.58% | 1.4% |
| Standard Deviation (Population) | 0.57% | 1.4% |
Similar Demographics by Doctorate Degree
Demographics Similar to Uruguayans by Doctorate Degree
In terms of doctorate degree, the demographic groups most similar to Uruguayans are Immigrants from Somalia (1.8%, a difference of 0.15%), German Russian (1.8%, a difference of 0.17%), Subsaharan African (1.8%, a difference of 0.22%), Chinese (1.8%, a difference of 0.23%), and Dutch (1.8%, a difference of 0.24%).
| Demographics | Rating | Rank | Doctorate Degree |
| Czechoslovakians | 33.0 /100 | #187 | Fair 1.8% |
| Germans | 30.5 /100 | #188 | Fair 1.8% |
| French Canadians | 30.2 /100 | #189 | Fair 1.8% |
| Immigrants | Costa Rica | 30.2 /100 | #190 | Fair 1.8% |
| South Americans | 29.5 /100 | #191 | Fair 1.8% |
| Dutch | 27.4 /100 | #192 | Fair 1.8% |
| German Russians | 27.1 /100 | #193 | Fair 1.8% |
| Uruguayans | 26.2 /100 | #194 | Fair 1.8% |
| Immigrants | Somalia | 25.4 /100 | #195 | Fair 1.8% |
| Sub-Saharan Africans | 25.1 /100 | #196 | Fair 1.8% |
| Chinese | 25.1 /100 | #197 | Fair 1.8% |
| Immigrants | Ghana | 24.6 /100 | #198 | Fair 1.8% |
| Immigrants | South America | 23.3 /100 | #199 | Fair 1.8% |
| Whites/Caucasians | 22.8 /100 | #200 | Fair 1.8% |
| Immigrants | Nigeria | 22.4 /100 | #201 | Fair 1.8% |
Demographics Similar to Americans by Doctorate Degree
In terms of doctorate degree, the demographic groups most similar to Americans are Immigrants from Cambodia (1.5%, a difference of 0.13%), Trinidadian and Tobagonian (1.5%, a difference of 0.13%), Yuman (1.5%, a difference of 0.15%), Central American Indian (1.5%, a difference of 0.18%), and Chippewa (1.5%, a difference of 0.40%).
| Demographics | Rating | Rank | Doctorate Degree |
| Hmong | 1.8 /100 | #246 | Tragic 1.6% |
| Comanche | 1.8 /100 | #247 | Tragic 1.6% |
| Africans | 1.8 /100 | #248 | Tragic 1.6% |
| Potawatomi | 1.6 /100 | #249 | Tragic 1.6% |
| Immigrants | Fiji | 1.6 /100 | #250 | Tragic 1.6% |
| Apache | 1.3 /100 | #251 | Tragic 1.5% |
| Yuman | 1.1 /100 | #252 | Tragic 1.5% |
| Americans | 1.0 /100 | #253 | Tragic 1.5% |
| Immigrants | Cambodia | 1.0 /100 | #254 | Tragic 1.5% |
| Trinidadians and Tobagonians | 1.0 /100 | #255 | Tragic 1.5% |
| Central American Indians | 1.0 /100 | #256 | Tragic 1.5% |
| Chippewa | 0.9 /100 | #257 | Tragic 1.5% |
| Immigrants | West Indies | 0.9 /100 | #258 | Tragic 1.5% |
| Liberians | 0.9 /100 | #259 | Tragic 1.5% |
| Japanese | 0.9 /100 | #260 | Tragic 1.5% |