Immigrants from Taiwan vs Immigrants from Malaysia Doctorate Degree
COMPARE
Immigrants from Taiwan
Immigrants from Malaysia
Doctorate Degree
Doctorate Degree Comparison
Immigrants from Taiwan
Immigrants from Malaysia
3.2%
DOCTORATE DEGREE
100.0/ 100
METRIC RATING
4th/ 347
METRIC RANK
2.6%
DOCTORATE DEGREE
100.0/ 100
METRIC RATING
35th/ 347
METRIC RANK
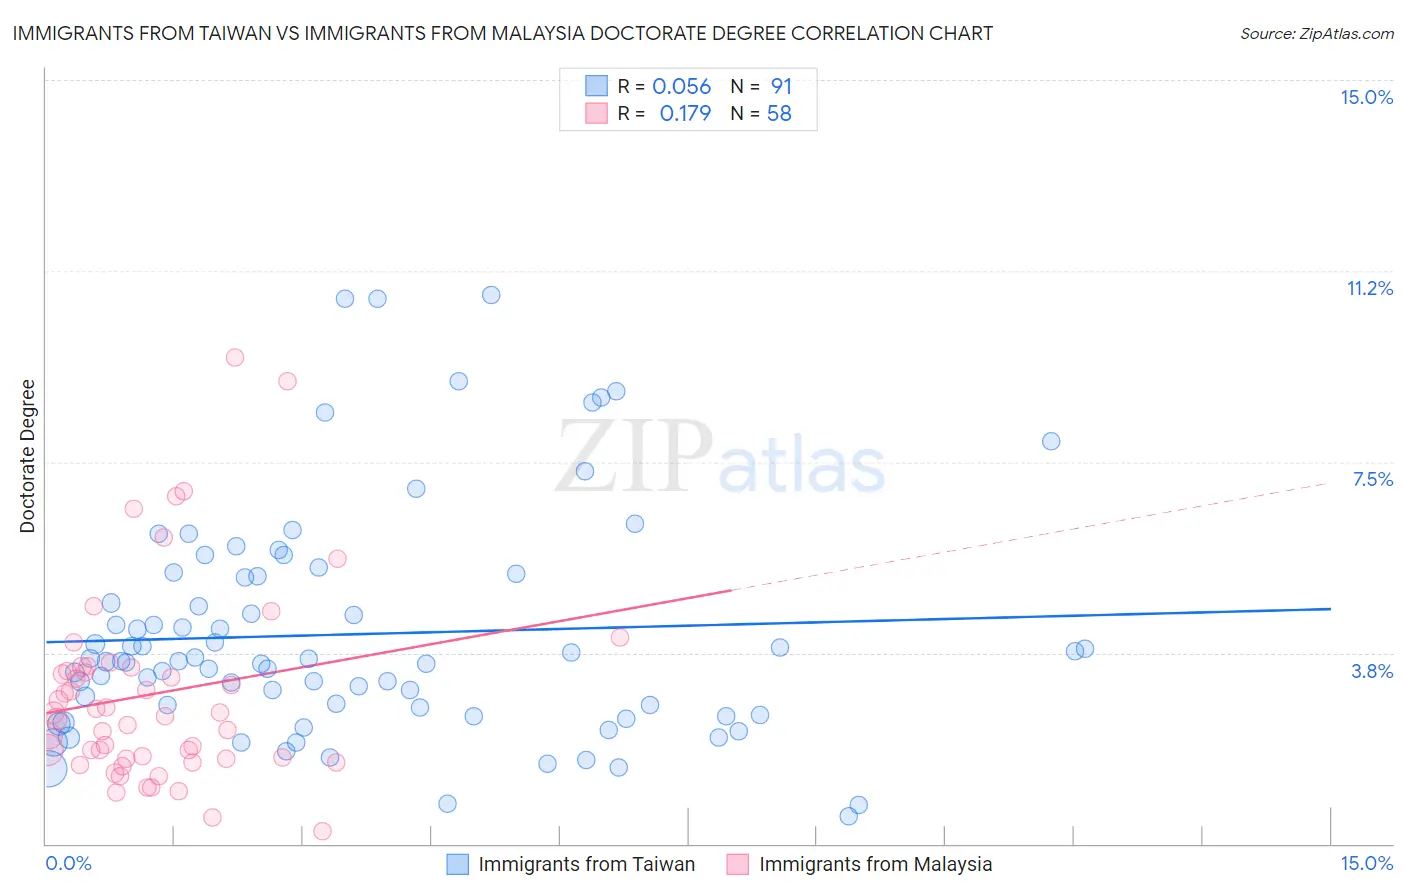
Immigrants from Taiwan vs Immigrants from Malaysia Doctorate Degree Correlation Chart
The statistical analysis conducted on geographies consisting of 297,175,735 people shows a slight positive correlation between the proportion of Immigrants from Taiwan and percentage of population with at least doctorate degree education in the United States with a correlation coefficient (R) of 0.056 and weighted average of 3.2%. Similarly, the statistical analysis conducted on geographies consisting of 197,613,478 people shows a poor positive correlation between the proportion of Immigrants from Malaysia and percentage of population with at least doctorate degree education in the United States with a correlation coefficient (R) of 0.179 and weighted average of 2.6%, a difference of 24.7%.
Doctorate Degree Correlation Summary
| Measurement | Immigrants from Taiwan | Immigrants from Malaysia |
| Minimum | 0.55% | 0.26% |
| Maximum | 10.8% | 9.6% |
| Range | 10.2% | 9.3% |
| Mean | 4.1% | 2.9% |
| Median | 3.6% | 2.5% |
| Interquartile 25% (IQ1) | 2.5% | 1.7% |
| Interquartile 75% (IQ3) | 5.3% | 3.5% |
| Interquartile Range (IQR) | 2.7% | 1.8% |
| Standard Deviation (Sample) | 2.2% | 1.9% |
| Standard Deviation (Population) | 2.2% | 1.9% |
Similar Demographics by Doctorate Degree
Demographics Similar to Immigrants from Taiwan by Doctorate Degree
In terms of doctorate degree, the demographic groups most similar to Immigrants from Taiwan are Iranian (3.1%, a difference of 1.5%), Okinawan (3.3%, a difference of 2.6%), Immigrants from Switzerland (3.1%, a difference of 3.5%), Immigrants from China (3.1%, a difference of 3.6%), and Immigrants from Israel (3.0%, a difference of 4.9%).
| Demographics | Rating | Rank | Doctorate Degree |
| Immigrants | Singapore | 100.0 /100 | #1 | Exceptional 3.7% |
| Filipinos | 100.0 /100 | #2 | Exceptional 3.4% |
| Okinawans | 100.0 /100 | #3 | Exceptional 3.3% |
| Immigrants | Taiwan | 100.0 /100 | #4 | Exceptional 3.2% |
| Iranians | 100.0 /100 | #5 | Exceptional 3.1% |
| Immigrants | Switzerland | 100.0 /100 | #6 | Exceptional 3.1% |
| Immigrants | China | 100.0 /100 | #7 | Exceptional 3.1% |
| Immigrants | Israel | 100.0 /100 | #8 | Exceptional 3.0% |
| Immigrants | Iran | 100.0 /100 | #9 | Exceptional 3.0% |
| Immigrants | Eastern Asia | 100.0 /100 | #10 | Exceptional 3.0% |
| Indians (Asian) | 100.0 /100 | #11 | Exceptional 2.9% |
| Immigrants | Belgium | 100.0 /100 | #12 | Exceptional 2.9% |
| Immigrants | Sweden | 100.0 /100 | #13 | Exceptional 2.9% |
| Immigrants | France | 100.0 /100 | #14 | Exceptional 2.9% |
| Immigrants | India | 100.0 /100 | #15 | Exceptional 2.8% |
Demographics Similar to Immigrants from Malaysia by Doctorate Degree
In terms of doctorate degree, the demographic groups most similar to Immigrants from Malaysia are Cypriot (2.6%, a difference of 0.060%), Immigrants from Spain (2.6%, a difference of 0.060%), Cambodian (2.6%, a difference of 0.17%), Immigrants from Kuwait (2.6%, a difference of 0.32%), and Immigrants from Northern Europe (2.6%, a difference of 0.35%).
| Demographics | Rating | Rank | Doctorate Degree |
| Burmese | 100.0 /100 | #28 | Exceptional 2.6% |
| Immigrants | South Central Asia | 100.0 /100 | #29 | Exceptional 2.6% |
| Immigrants | Korea | 100.0 /100 | #30 | Exceptional 2.6% |
| Latvians | 100.0 /100 | #31 | Exceptional 2.6% |
| Immigrants | Northern Europe | 100.0 /100 | #32 | Exceptional 2.6% |
| Cambodians | 100.0 /100 | #33 | Exceptional 2.6% |
| Cypriots | 100.0 /100 | #34 | Exceptional 2.6% |
| Immigrants | Malaysia | 100.0 /100 | #35 | Exceptional 2.6% |
| Immigrants | Spain | 100.0 /100 | #36 | Exceptional 2.6% |
| Immigrants | Kuwait | 100.0 /100 | #37 | Exceptional 2.6% |
| Russians | 100.0 /100 | #38 | Exceptional 2.6% |
| Immigrants | Ireland | 100.0 /100 | #39 | Exceptional 2.5% |
| Estonians | 100.0 /100 | #40 | Exceptional 2.5% |
| Immigrants | Russia | 100.0 /100 | #41 | Exceptional 2.5% |
| New Zealanders | 100.0 /100 | #42 | Exceptional 2.5% |