Immigrants from Taiwan vs Pakistani 10th Grade
COMPARE
Immigrants from Taiwan
Pakistani
10th Grade
10th Grade Comparison
Immigrants from Taiwan
Pakistanis
94.4%
10TH GRADE
95.3/ 100
METRIC RATING
120th/ 347
METRIC RANK
93.9%
10TH GRADE
70.1/ 100
METRIC RATING
160th/ 347
METRIC RANK
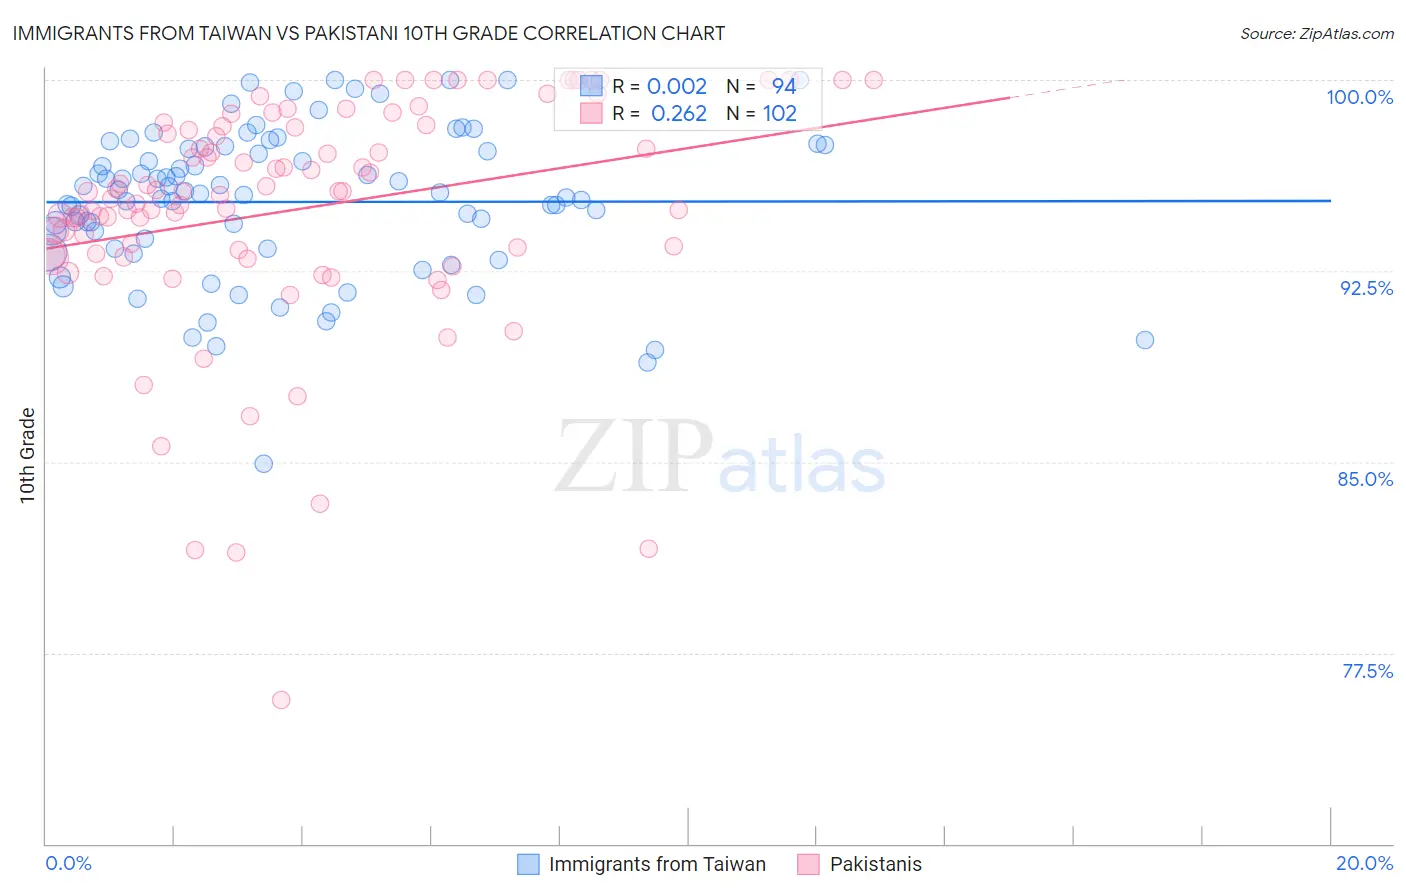
Immigrants from Taiwan vs Pakistani 10th Grade Correlation Chart
The statistical analysis conducted on geographies consisting of 298,119,887 people shows no correlation between the proportion of Immigrants from Taiwan and percentage of population with at least 10th grade education in the United States with a correlation coefficient (R) of 0.002 and weighted average of 94.4%. Similarly, the statistical analysis conducted on geographies consisting of 335,356,437 people shows a weak positive correlation between the proportion of Pakistanis and percentage of population with at least 10th grade education in the United States with a correlation coefficient (R) of 0.262 and weighted average of 93.9%, a difference of 0.48%.
10th Grade Correlation Summary
| Measurement | Immigrants from Taiwan | Pakistani |
| Minimum | 84.9% | 75.6% |
| Maximum | 100.0% | 100.0% |
| Range | 15.1% | 24.4% |
| Mean | 95.2% | 94.9% |
| Median | 95.6% | 95.6% |
| Interquartile 25% (IQ1) | 93.4% | 93.2% |
| Interquartile 75% (IQ3) | 97.4% | 98.2% |
| Interquartile Range (IQR) | 4.0% | 5.0% |
| Standard Deviation (Sample) | 2.9% | 4.6% |
| Standard Deviation (Population) | 2.9% | 4.6% |
Similar Demographics by 10th Grade
Demographics Similar to Immigrants from Taiwan by 10th Grade
In terms of 10th grade, the demographic groups most similar to Immigrants from Taiwan are Jordanian (94.4%, a difference of 0.010%), Immigrants from Israel (94.4%, a difference of 0.010%), Immigrants from Belarus (94.4%, a difference of 0.010%), Inupiat (94.4%, a difference of 0.010%), and Cree (94.4%, a difference of 0.010%).
| Demographics | Rating | Rank | 10th Grade |
| Palestinians | 96.5 /100 | #113 | Exceptional 94.4% |
| German Russians | 96.3 /100 | #114 | Exceptional 94.4% |
| Delaware | 96.3 /100 | #115 | Exceptional 94.4% |
| Sioux | 96.2 /100 | #116 | Exceptional 94.4% |
| Immigrants | Hungary | 95.8 /100 | #117 | Exceptional 94.4% |
| Jordanians | 95.6 /100 | #118 | Exceptional 94.4% |
| Immigrants | Israel | 95.4 /100 | #119 | Exceptional 94.4% |
| Immigrants | Taiwan | 95.3 /100 | #120 | Exceptional 94.4% |
| Immigrants | Belarus | 95.2 /100 | #121 | Exceptional 94.4% |
| Inupiat | 95.1 /100 | #122 | Exceptional 94.4% |
| Cree | 95.1 /100 | #123 | Exceptional 94.4% |
| Basques | 94.9 /100 | #124 | Exceptional 94.3% |
| Americans | 94.4 /100 | #125 | Exceptional 94.3% |
| Immigrants | Iran | 94.4 /100 | #126 | Exceptional 94.3% |
| Israelis | 93.8 /100 | #127 | Exceptional 94.3% |
Demographics Similar to Pakistanis by 10th Grade
In terms of 10th grade, the demographic groups most similar to Pakistanis are Chilean (93.9%, a difference of 0.0%), Assyrian/Chaldean/Syriac (93.9%, a difference of 0.0%), Bermudan (93.9%, a difference of 0.010%), Immigrants from Poland (93.9%, a difference of 0.010%), and Venezuelan (93.9%, a difference of 0.010%).
| Demographics | Rating | Rank | 10th Grade |
| Immigrants | Brazil | 75.5 /100 | #153 | Good 94.0% |
| Immigrants | Kenya | 75.3 /100 | #154 | Good 94.0% |
| Spanish | 74.9 /100 | #155 | Good 94.0% |
| Mongolians | 74.4 /100 | #156 | Good 94.0% |
| Kiowa | 73.3 /100 | #157 | Good 93.9% |
| Bermudans | 71.0 /100 | #158 | Good 93.9% |
| Chileans | 70.2 /100 | #159 | Good 93.9% |
| Pakistanis | 70.1 /100 | #160 | Good 93.9% |
| Assyrians/Chaldeans/Syriacs | 69.7 /100 | #161 | Good 93.9% |
| Immigrants | Poland | 69.6 /100 | #162 | Good 93.9% |
| Venezuelans | 69.5 /100 | #163 | Good 93.9% |
| Iraqis | 68.1 /100 | #164 | Good 93.9% |
| Brazilians | 63.6 /100 | #165 | Good 93.8% |
| Immigrants | Iraq | 63.0 /100 | #166 | Good 93.8% |
| Immigrants | Egypt | 62.3 /100 | #167 | Good 93.8% |