Immigrants from Costa Rica vs Pakistani 10th Grade
COMPARE
Immigrants from Costa Rica
Pakistani
10th Grade
10th Grade Comparison
Immigrants from Costa Rica
Pakistanis
92.7%
10TH GRADE
0.6/ 100
METRIC RATING
258th/ 347
METRIC RANK
93.9%
10TH GRADE
70.1/ 100
METRIC RATING
160th/ 347
METRIC RANK
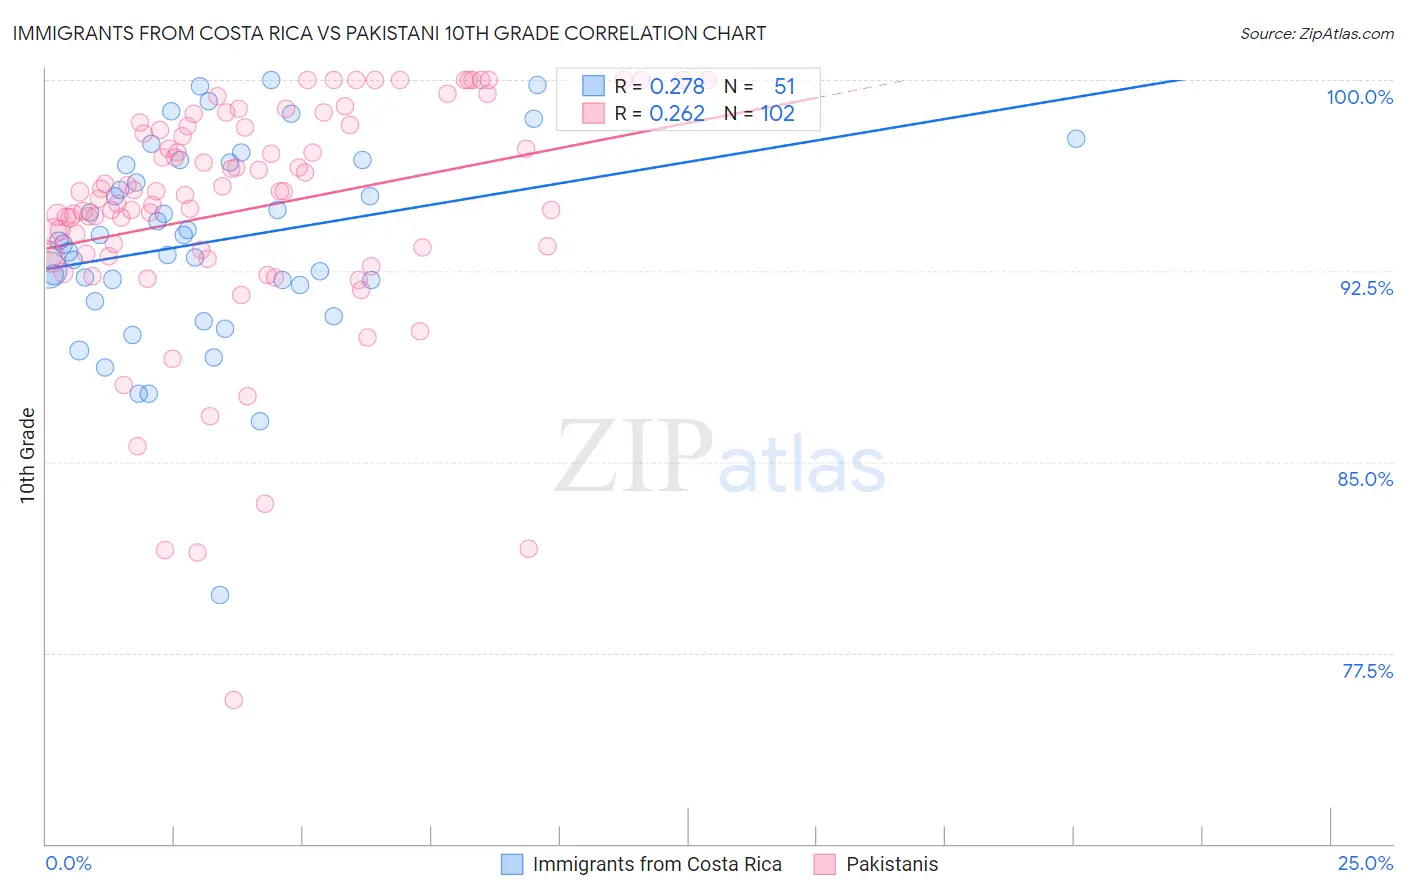
Immigrants from Costa Rica vs Pakistani 10th Grade Correlation Chart
The statistical analysis conducted on geographies consisting of 204,277,241 people shows a weak positive correlation between the proportion of Immigrants from Costa Rica and percentage of population with at least 10th grade education in the United States with a correlation coefficient (R) of 0.278 and weighted average of 92.7%. Similarly, the statistical analysis conducted on geographies consisting of 335,356,437 people shows a weak positive correlation between the proportion of Pakistanis and percentage of population with at least 10th grade education in the United States with a correlation coefficient (R) of 0.262 and weighted average of 93.9%, a difference of 1.3%.
10th Grade Correlation Summary
| Measurement | Immigrants from Costa Rica | Pakistani |
| Minimum | 79.8% | 75.6% |
| Maximum | 100.0% | 100.0% |
| Range | 20.2% | 24.4% |
| Mean | 93.7% | 94.9% |
| Median | 93.7% | 95.6% |
| Interquartile 25% (IQ1) | 91.9% | 93.2% |
| Interquartile 75% (IQ3) | 96.8% | 98.2% |
| Interquartile Range (IQR) | 4.9% | 5.0% |
| Standard Deviation (Sample) | 3.9% | 4.6% |
| Standard Deviation (Population) | 3.9% | 4.6% |
Similar Demographics by 10th Grade
Demographics Similar to Immigrants from Costa Rica by 10th Grade
In terms of 10th grade, the demographic groups most similar to Immigrants from Costa Rica are U.S. Virgin Islander (92.7%, a difference of 0.010%), Immigrants from Nigeria (92.7%, a difference of 0.020%), Immigrants from Bolivia (92.7%, a difference of 0.030%), Immigrants from Jamaica (92.6%, a difference of 0.040%), and Immigrants from Uzbekistan (92.6%, a difference of 0.050%).
| Demographics | Rating | Rank | 10th Grade |
| Immigrants | Thailand | 1.0 /100 | #251 | Tragic 92.8% |
| South Americans | 0.9 /100 | #252 | Tragic 92.8% |
| Ghanaians | 0.9 /100 | #253 | Tragic 92.8% |
| Armenians | 0.9 /100 | #254 | Tragic 92.7% |
| Immigrants | Bolivia | 0.7 /100 | #255 | Tragic 92.7% |
| Immigrants | Nigeria | 0.7 /100 | #256 | Tragic 92.7% |
| U.S. Virgin Islanders | 0.7 /100 | #257 | Tragic 92.7% |
| Immigrants | Costa Rica | 0.6 /100 | #258 | Tragic 92.7% |
| Immigrants | Jamaica | 0.5 /100 | #259 | Tragic 92.6% |
| Immigrants | Uzbekistan | 0.5 /100 | #260 | Tragic 92.6% |
| Paiute | 0.4 /100 | #261 | Tragic 92.6% |
| Immigrants | South America | 0.4 /100 | #262 | Tragic 92.6% |
| Apache | 0.4 /100 | #263 | Tragic 92.6% |
| Peruvians | 0.4 /100 | #264 | Tragic 92.6% |
| Dutch West Indians | 0.4 /100 | #265 | Tragic 92.6% |
Demographics Similar to Pakistanis by 10th Grade
In terms of 10th grade, the demographic groups most similar to Pakistanis are Chilean (93.9%, a difference of 0.0%), Assyrian/Chaldean/Syriac (93.9%, a difference of 0.0%), Bermudan (93.9%, a difference of 0.010%), Immigrants from Poland (93.9%, a difference of 0.010%), and Venezuelan (93.9%, a difference of 0.010%).
| Demographics | Rating | Rank | 10th Grade |
| Immigrants | Brazil | 75.5 /100 | #153 | Good 94.0% |
| Immigrants | Kenya | 75.3 /100 | #154 | Good 94.0% |
| Spanish | 74.9 /100 | #155 | Good 94.0% |
| Mongolians | 74.4 /100 | #156 | Good 94.0% |
| Kiowa | 73.3 /100 | #157 | Good 93.9% |
| Bermudans | 71.0 /100 | #158 | Good 93.9% |
| Chileans | 70.2 /100 | #159 | Good 93.9% |
| Pakistanis | 70.1 /100 | #160 | Good 93.9% |
| Assyrians/Chaldeans/Syriacs | 69.7 /100 | #161 | Good 93.9% |
| Immigrants | Poland | 69.6 /100 | #162 | Good 93.9% |
| Venezuelans | 69.5 /100 | #163 | Good 93.9% |
| Iraqis | 68.1 /100 | #164 | Good 93.9% |
| Brazilians | 63.6 /100 | #165 | Good 93.8% |
| Immigrants | Iraq | 63.0 /100 | #166 | Good 93.8% |
| Immigrants | Egypt | 62.3 /100 | #167 | Good 93.8% |