Immigrants from Taiwan vs Barbadian Kindergarten
COMPARE
Immigrants from Taiwan
Barbadian
Kindergarten
Kindergarten Comparison
Immigrants from Taiwan
Barbadians
97.9%
KINDERGARTEN
30.7/ 100
METRIC RATING
191st/ 347
METRIC RANK
97.4%
KINDERGARTEN
0.1/ 100
METRIC RATING
280th/ 347
METRIC RANK
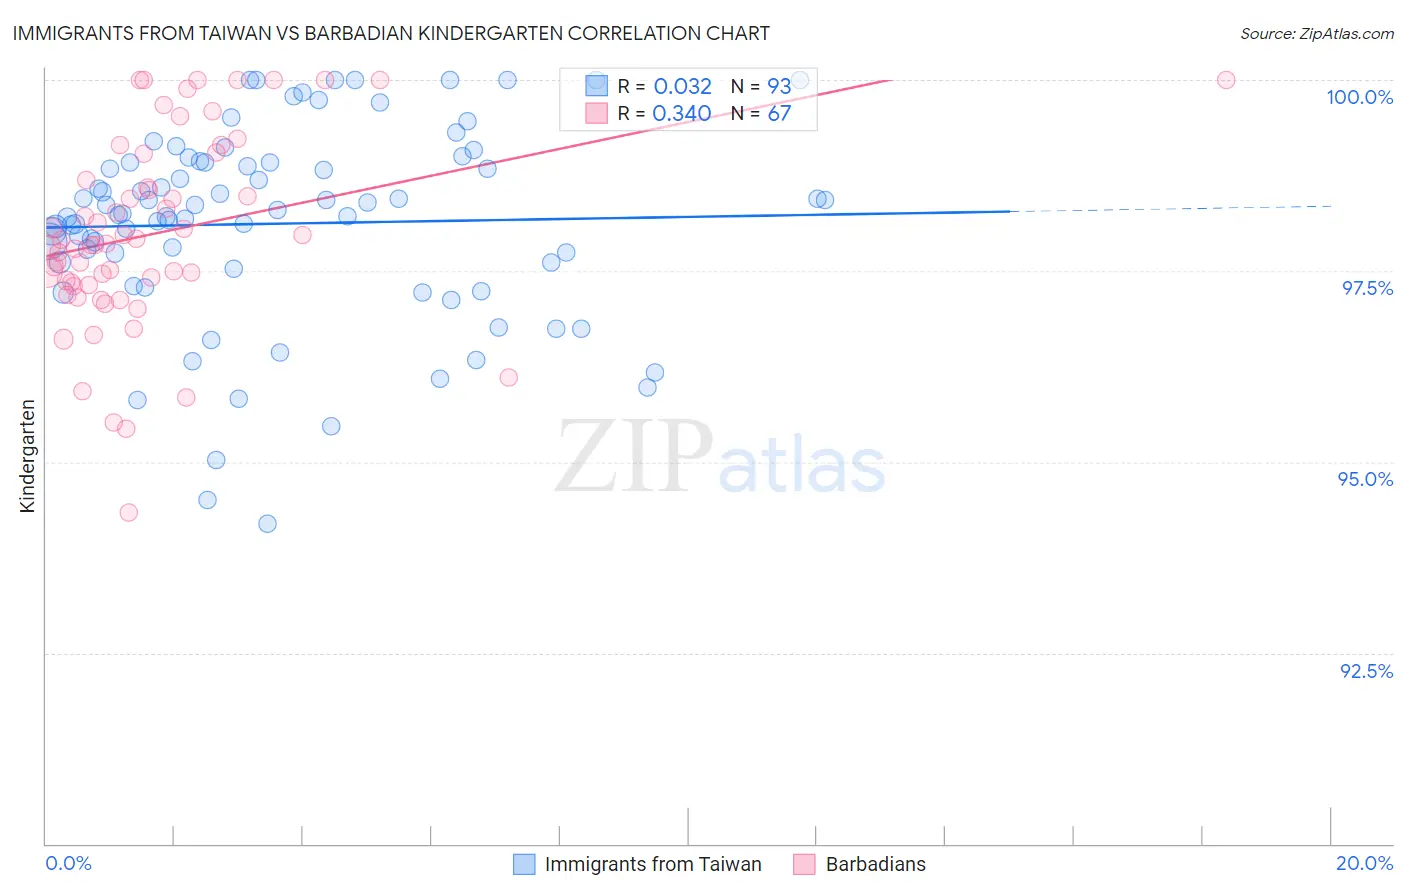
Immigrants from Taiwan vs Barbadian Kindergarten Correlation Chart
The statistical analysis conducted on geographies consisting of 298,069,082 people shows no correlation between the proportion of Immigrants from Taiwan and percentage of population with at least kindergarten education in the United States with a correlation coefficient (R) of 0.032 and weighted average of 97.9%. Similarly, the statistical analysis conducted on geographies consisting of 141,304,590 people shows a mild positive correlation between the proportion of Barbadians and percentage of population with at least kindergarten education in the United States with a correlation coefficient (R) of 0.340 and weighted average of 97.4%, a difference of 0.52%.
Kindergarten Correlation Summary
| Measurement | Immigrants from Taiwan | Barbadian |
| Minimum | 94.2% | 94.3% |
| Maximum | 100.0% | 100.0% |
| Range | 5.8% | 5.7% |
| Mean | 98.1% | 98.0% |
| Median | 98.2% | 97.9% |
| Interquartile 25% (IQ1) | 97.6% | 97.3% |
| Interquartile 75% (IQ3) | 98.9% | 99.0% |
| Interquartile Range (IQR) | 1.4% | 1.7% |
| Standard Deviation (Sample) | 1.3% | 1.3% |
| Standard Deviation (Population) | 1.3% | 1.2% |
Similar Demographics by Kindergarten
Demographics Similar to Immigrants from Taiwan by Kindergarten
In terms of kindergarten, the demographic groups most similar to Immigrants from Taiwan are Black/African American (97.9%, a difference of 0.0%), Paraguayan (97.9%, a difference of 0.0%), Paiute (97.9%, a difference of 0.010%), Panamanian (97.9%, a difference of 0.010%), and Hawaiian (97.9%, a difference of 0.010%).
| Demographics | Rating | Rank | Kindergarten |
| Immigrants | Argentina | 40.7 /100 | #184 | Average 97.9% |
| Immigrants | Belarus | 39.4 /100 | #185 | Fair 97.9% |
| Pakistanis | 36.0 /100 | #186 | Fair 97.9% |
| Immigrants | Kazakhstan | 35.9 /100 | #187 | Fair 97.9% |
| Arabs | 35.4 /100 | #188 | Fair 97.9% |
| Paiute | 34.7 /100 | #189 | Fair 97.9% |
| Panamanians | 33.3 /100 | #190 | Fair 97.9% |
| Immigrants | Taiwan | 30.7 /100 | #191 | Fair 97.9% |
| Blacks/African Americans | 29.9 /100 | #192 | Fair 97.9% |
| Paraguayans | 29.6 /100 | #193 | Fair 97.9% |
| Hawaiians | 29.3 /100 | #194 | Fair 97.9% |
| Mongolians | 28.9 /100 | #195 | Fair 97.9% |
| Guamanians/Chamorros | 26.2 /100 | #196 | Fair 97.9% |
| Immigrants | Kenya | 25.5 /100 | #197 | Fair 97.9% |
| Tohono O'odham | 24.6 /100 | #198 | Fair 97.9% |
Demographics Similar to Barbadians by Kindergarten
In terms of kindergarten, the demographic groups most similar to Barbadians are Immigrants from Ghana (97.4%, a difference of 0.0%), Trinidadian and Tobagonian (97.4%, a difference of 0.0%), Immigrants from Uzbekistan (97.4%, a difference of 0.010%), Afghan (97.4%, a difference of 0.010%), and Immigrants from Western Africa (97.4%, a difference of 0.030%).
| Demographics | Rating | Rank | Kindergarten |
| Immigrants | China | 0.1 /100 | #273 | Tragic 97.4% |
| Immigrants | Cameroon | 0.1 /100 | #274 | Tragic 97.4% |
| Ghanaians | 0.1 /100 | #275 | Tragic 97.4% |
| Immigrants | Philippines | 0.1 /100 | #276 | Tragic 97.4% |
| Immigrants | Western Africa | 0.1 /100 | #277 | Tragic 97.4% |
| Immigrants | Uzbekistan | 0.1 /100 | #278 | Tragic 97.4% |
| Immigrants | Ghana | 0.1 /100 | #279 | Tragic 97.4% |
| Barbadians | 0.1 /100 | #280 | Tragic 97.4% |
| Trinidadians and Tobagonians | 0.1 /100 | #281 | Tragic 97.4% |
| Afghans | 0.0 /100 | #282 | Tragic 97.4% |
| Immigrants | West Indies | 0.0 /100 | #283 | Tragic 97.3% |
| Immigrants | Trinidad and Tobago | 0.0 /100 | #284 | Tragic 97.3% |
| Immigrants | Portugal | 0.0 /100 | #285 | Tragic 97.3% |
| Immigrants | Barbados | 0.0 /100 | #286 | Tragic 97.3% |
| Immigrants | Hong Kong | 0.0 /100 | #287 | Tragic 97.3% |