Immigrants from Taiwan vs Senegalese Kindergarten
COMPARE
Immigrants from Taiwan
Senegalese
Kindergarten
Kindergarten Comparison
Immigrants from Taiwan
Senegalese
97.9%
KINDERGARTEN
30.7/ 100
METRIC RATING
191st/ 347
METRIC RANK
97.7%
KINDERGARTEN
3.3/ 100
METRIC RATING
230th/ 347
METRIC RANK
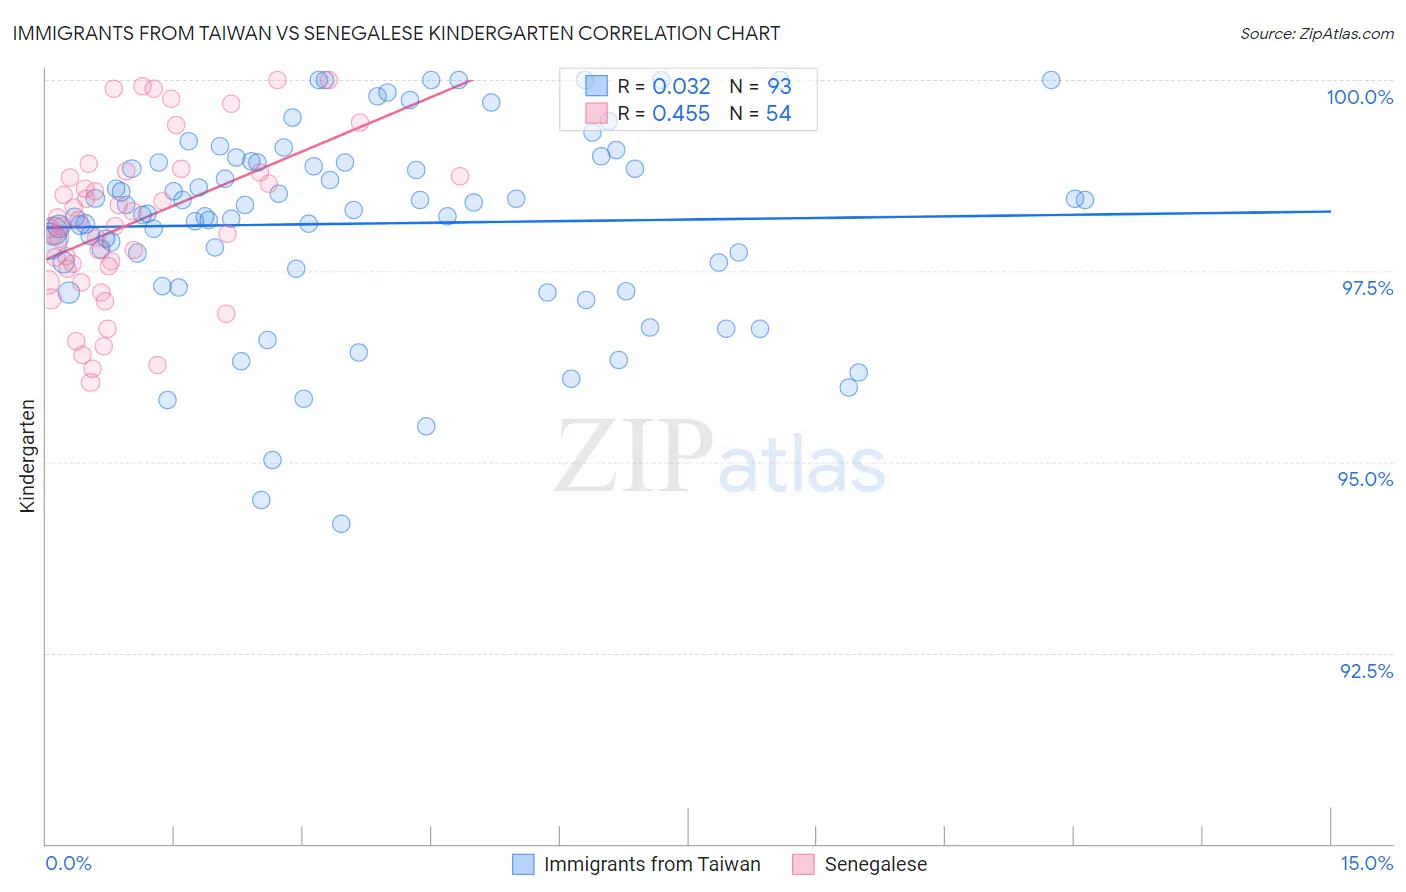
Immigrants from Taiwan vs Senegalese Kindergarten Correlation Chart
The statistical analysis conducted on geographies consisting of 298,069,082 people shows no correlation between the proportion of Immigrants from Taiwan and percentage of population with at least kindergarten education in the United States with a correlation coefficient (R) of 0.032 and weighted average of 97.9%. Similarly, the statistical analysis conducted on geographies consisting of 78,142,569 people shows a moderate positive correlation between the proportion of Senegalese and percentage of population with at least kindergarten education in the United States with a correlation coefficient (R) of 0.455 and weighted average of 97.7%, a difference of 0.20%.
Kindergarten Correlation Summary
| Measurement | Immigrants from Taiwan | Senegalese |
| Minimum | 94.2% | 96.0% |
| Maximum | 100.0% | 100.0% |
| Range | 5.8% | 4.0% |
| Mean | 98.1% | 98.1% |
| Median | 98.2% | 98.1% |
| Interquartile 25% (IQ1) | 97.6% | 97.5% |
| Interquartile 75% (IQ3) | 98.9% | 98.7% |
| Interquartile Range (IQR) | 1.4% | 1.2% |
| Standard Deviation (Sample) | 1.3% | 1.0% |
| Standard Deviation (Population) | 1.3% | 1.0% |
Similar Demographics by Kindergarten
Demographics Similar to Immigrants from Taiwan by Kindergarten
In terms of kindergarten, the demographic groups most similar to Immigrants from Taiwan are Black/African American (97.9%, a difference of 0.0%), Paraguayan (97.9%, a difference of 0.0%), Paiute (97.9%, a difference of 0.010%), Panamanian (97.9%, a difference of 0.010%), and Hawaiian (97.9%, a difference of 0.010%).
| Demographics | Rating | Rank | Kindergarten |
| Immigrants | Argentina | 40.7 /100 | #184 | Average 97.9% |
| Immigrants | Belarus | 39.4 /100 | #185 | Fair 97.9% |
| Pakistanis | 36.0 /100 | #186 | Fair 97.9% |
| Immigrants | Kazakhstan | 35.9 /100 | #187 | Fair 97.9% |
| Arabs | 35.4 /100 | #188 | Fair 97.9% |
| Paiute | 34.7 /100 | #189 | Fair 97.9% |
| Panamanians | 33.3 /100 | #190 | Fair 97.9% |
| Immigrants | Taiwan | 30.7 /100 | #191 | Fair 97.9% |
| Blacks/African Americans | 29.9 /100 | #192 | Fair 97.9% |
| Paraguayans | 29.6 /100 | #193 | Fair 97.9% |
| Hawaiians | 29.3 /100 | #194 | Fair 97.9% |
| Mongolians | 28.9 /100 | #195 | Fair 97.9% |
| Guamanians/Chamorros | 26.2 /100 | #196 | Fair 97.9% |
| Immigrants | Kenya | 25.5 /100 | #197 | Fair 97.9% |
| Tohono O'odham | 24.6 /100 | #198 | Fair 97.9% |
Demographics Similar to Senegalese by Kindergarten
In terms of kindergarten, the demographic groups most similar to Senegalese are Subsaharan African (97.7%, a difference of 0.0%), Sierra Leonean (97.7%, a difference of 0.0%), Iraqi (97.7%, a difference of 0.010%), Immigrants from Nepal (97.7%, a difference of 0.010%), and Sudanese (97.7%, a difference of 0.010%).
| Demographics | Rating | Rank | Kindergarten |
| Immigrants | Syria | 4.3 /100 | #223 | Tragic 97.7% |
| Iraqis | 3.9 /100 | #224 | Tragic 97.7% |
| Immigrants | Nepal | 3.8 /100 | #225 | Tragic 97.7% |
| Sudanese | 3.7 /100 | #226 | Tragic 97.7% |
| Immigrants | Costa Rica | 3.6 /100 | #227 | Tragic 97.7% |
| Sub-Saharan Africans | 3.5 /100 | #228 | Tragic 97.7% |
| Sierra Leoneans | 3.4 /100 | #229 | Tragic 97.7% |
| Senegalese | 3.3 /100 | #230 | Tragic 97.7% |
| Puerto Ricans | 2.7 /100 | #231 | Tragic 97.7% |
| Immigrants | Uruguay | 2.6 /100 | #232 | Tragic 97.7% |
| Immigrants | Pakistan | 2.2 /100 | #233 | Tragic 97.7% |
| Immigrants | Malaysia | 2.2 /100 | #234 | Tragic 97.7% |
| Colombians | 2.2 /100 | #235 | Tragic 97.7% |
| Immigrants | Western Asia | 2.1 /100 | #236 | Tragic 97.7% |
| Nigerians | 1.8 /100 | #237 | Tragic 97.6% |