Immigrants from Syria vs Lebanese College, Under 1 year
COMPARE
Immigrants from Syria
Lebanese
College, Under 1 year
College, Under 1 year Comparison
Immigrants from Syria
Lebanese
66.9%
COLLEGE, UNDER 1 YEAR
89.0/ 100
METRIC RATING
130th/ 347
METRIC RANK
67.5%
COLLEGE, UNDER 1 YEAR
94.6/ 100
METRIC RATING
119th/ 347
METRIC RANK
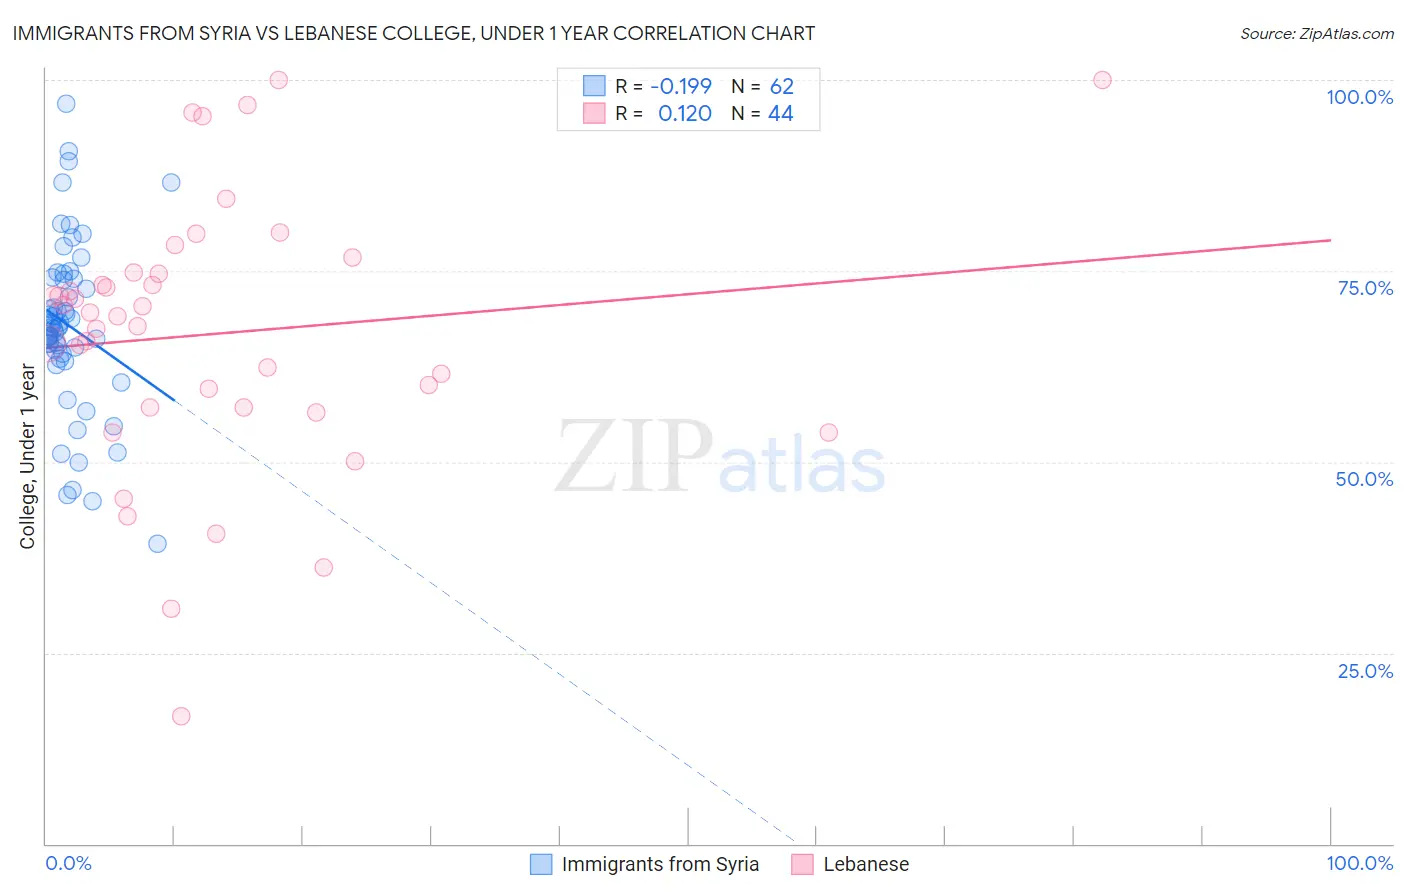
Immigrants from Syria vs Lebanese College, Under 1 year Correlation Chart
The statistical analysis conducted on geographies consisting of 174,109,130 people shows a poor negative correlation between the proportion of Immigrants from Syria and percentage of population with at least college, under 1 year education in the United States with a correlation coefficient (R) of -0.199 and weighted average of 66.9%. Similarly, the statistical analysis conducted on geographies consisting of 401,622,274 people shows a poor positive correlation between the proportion of Lebanese and percentage of population with at least college, under 1 year education in the United States with a correlation coefficient (R) of 0.120 and weighted average of 67.5%, a difference of 0.83%.
College, Under 1 year Correlation Summary
| Measurement | Immigrants from Syria | Lebanese |
| Minimum | 39.2% | 16.6% |
| Maximum | 96.9% | 100.0% |
| Range | 57.7% | 83.4% |
| Mean | 67.8% | 66.8% |
| Median | 67.7% | 69.3% |
| Interquartile 25% (IQ1) | 64.1% | 57.1% |
| Interquartile 75% (IQ3) | 74.0% | 74.7% |
| Interquartile Range (IQR) | 9.9% | 17.6% |
| Standard Deviation (Sample) | 11.2% | 17.8% |
| Standard Deviation (Population) | 11.1% | 17.6% |
Demographics Similar to Immigrants from Syria and Lebanese by College, Under 1 year
In terms of college, under 1 year, the demographic groups most similar to Immigrants from Syria are Finnish (66.9%, a difference of 0.040%), Immigrants from Eastern Africa (67.0%, a difference of 0.060%), Polish (66.9%, a difference of 0.060%), Immigrants from Brazil (66.9%, a difference of 0.070%), and Iraqi (66.8%, a difference of 0.11%). Similarly, the demographic groups most similar to Lebanese are Immigrants from Ukraine (67.5%, a difference of 0.010%), Pakistani (67.5%, a difference of 0.040%), Immigrants from Nepal (67.5%, a difference of 0.060%), Basque (67.6%, a difference of 0.14%), and Chilean (67.6%, a difference of 0.15%).
| Demographics | Rating | Rank | College, Under 1 year |
| Chileans | 95.3 /100 | #114 | Exceptional 67.6% |
| Basques | 95.2 /100 | #115 | Exceptional 67.6% |
| Immigrants | Nepal | 94.9 /100 | #116 | Exceptional 67.5% |
| Pakistanis | 94.8 /100 | #117 | Exceptional 67.5% |
| Immigrants | Ukraine | 94.7 /100 | #118 | Exceptional 67.5% |
| Lebanese | 94.6 /100 | #119 | Exceptional 67.5% |
| Serbians | 93.9 /100 | #120 | Exceptional 67.4% |
| Slovenes | 93.3 /100 | #121 | Exceptional 67.3% |
| Immigrants | Jordan | 92.8 /100 | #122 | Exceptional 67.3% |
| Immigrants | Northern Africa | 92.7 /100 | #123 | Exceptional 67.2% |
| Arabs | 92.6 /100 | #124 | Exceptional 67.2% |
| Italians | 91.8 /100 | #125 | Exceptional 67.2% |
| Alsatians | 91.3 /100 | #126 | Exceptional 67.1% |
| Czechs | 90.8 /100 | #127 | Exceptional 67.1% |
| Scottish | 90.2 /100 | #128 | Exceptional 67.0% |
| Immigrants | Eastern Africa | 89.5 /100 | #129 | Excellent 67.0% |
| Immigrants | Syria | 89.0 /100 | #130 | Excellent 66.9% |
| Finns | 88.6 /100 | #131 | Excellent 66.9% |
| Poles | 88.4 /100 | #132 | Excellent 66.9% |
| Immigrants | Brazil | 88.3 /100 | #133 | Excellent 66.9% |
| Iraqis | 88.0 /100 | #134 | Excellent 66.8% |