Immigrants from Austria vs Immigrants from Russia Bachelor's Degree
COMPARE
Immigrants from Austria
Immigrants from Russia
Bachelor's Degree
Bachelor's Degree Comparison
Immigrants from Austria
Immigrants from Russia
44.2%
BACHELOR'S DEGREE
99.9/ 100
METRIC RATING
54th/ 347
METRIC RANK
45.4%
BACHELOR'S DEGREE
100.0/ 100
METRIC RATING
35th/ 347
METRIC RANK
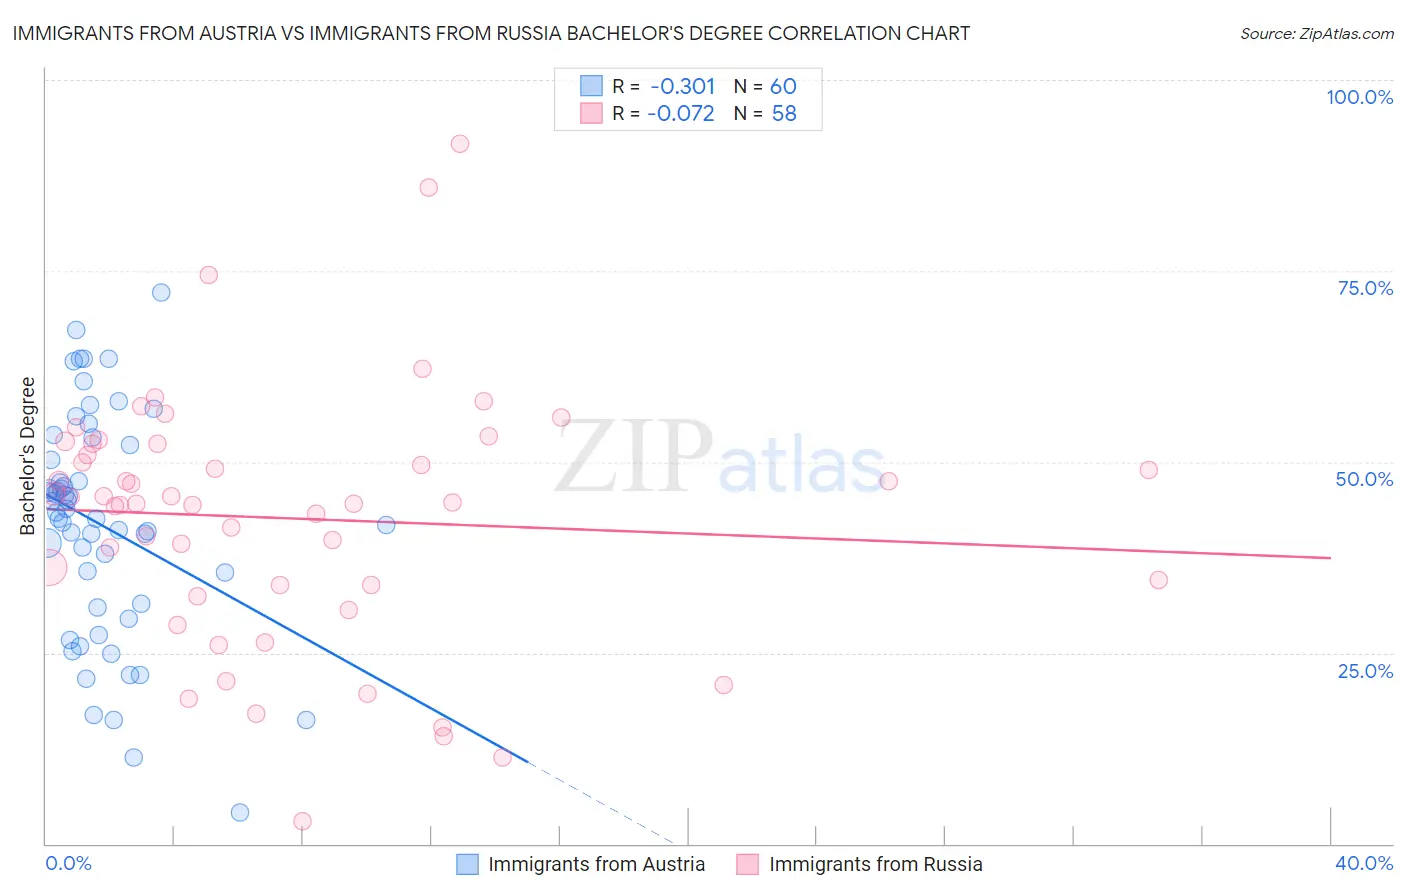
Immigrants from Austria vs Immigrants from Russia Bachelor's Degree Correlation Chart
The statistical analysis conducted on geographies consisting of 167,971,732 people shows a mild negative correlation between the proportion of Immigrants from Austria and percentage of population with at least bachelor's degree education in the United States with a correlation coefficient (R) of -0.301 and weighted average of 44.2%. Similarly, the statistical analysis conducted on geographies consisting of 347,903,485 people shows a slight negative correlation between the proportion of Immigrants from Russia and percentage of population with at least bachelor's degree education in the United States with a correlation coefficient (R) of -0.072 and weighted average of 45.4%, a difference of 2.7%.
Bachelor's Degree Correlation Summary
| Measurement | Immigrants from Austria | Immigrants from Russia |
| Minimum | 4.1% | 2.9% |
| Maximum | 72.2% | 91.7% |
| Range | 68.1% | 88.8% |
| Mean | 41.7% | 42.6% |
| Median | 43.0% | 44.6% |
| Interquartile 25% (IQ1) | 31.2% | 33.9% |
| Interquartile 75% (IQ3) | 51.2% | 52.3% |
| Interquartile Range (IQR) | 20.0% | 18.5% |
| Standard Deviation (Sample) | 14.7% | 16.7% |
| Standard Deviation (Population) | 14.6% | 16.5% |
Demographics Similar to Immigrants from Austria and Immigrants from Russia by Bachelor's Degree
In terms of bachelor's degree, the demographic groups most similar to Immigrants from Austria are Immigrants from Asia (44.3%, a difference of 0.19%), Immigrants from Spain (44.3%, a difference of 0.24%), Asian (44.4%, a difference of 0.43%), Immigrants from Greece (44.5%, a difference of 0.56%), and Immigrants from Norway (44.5%, a difference of 0.68%). Similarly, the demographic groups most similar to Immigrants from Russia are Mongolian (45.4%, a difference of 0.020%), Immigrants from Denmark (45.4%, a difference of 0.030%), Russian (45.3%, a difference of 0.17%), Bulgarian (45.3%, a difference of 0.26%), and Immigrants from Latvia (45.1%, a difference of 0.59%).
| Demographics | Rating | Rank | Bachelor's Degree |
| Immigrants | Denmark | 100.0 /100 | #34 | Exceptional 45.4% |
| Immigrants | Russia | 100.0 /100 | #35 | Exceptional 45.4% |
| Mongolians | 100.0 /100 | #36 | Exceptional 45.4% |
| Russians | 100.0 /100 | #37 | Exceptional 45.3% |
| Bulgarians | 100.0 /100 | #38 | Exceptional 45.3% |
| Immigrants | Latvia | 100.0 /100 | #39 | Exceptional 45.1% |
| Immigrants | Belarus | 100.0 /100 | #40 | Exceptional 45.0% |
| Immigrants | Malaysia | 100.0 /100 | #41 | Exceptional 45.0% |
| Immigrants | Saudi Arabia | 100.0 /100 | #42 | Exceptional 44.8% |
| Immigrants | South Africa | 99.9 /100 | #43 | Exceptional 44.8% |
| Immigrants | Lithuania | 99.9 /100 | #44 | Exceptional 44.6% |
| Immigrants | Kuwait | 99.9 /100 | #45 | Exceptional 44.6% |
| Immigrants | Bulgaria | 99.9 /100 | #46 | Exceptional 44.6% |
| Bolivians | 99.9 /100 | #47 | Exceptional 44.6% |
| Estonians | 99.9 /100 | #48 | Exceptional 44.6% |
| Immigrants | Norway | 99.9 /100 | #49 | Exceptional 44.5% |
| Immigrants | Greece | 99.9 /100 | #50 | Exceptional 44.5% |
| Asians | 99.9 /100 | #51 | Exceptional 44.4% |
| Immigrants | Spain | 99.9 /100 | #52 | Exceptional 44.3% |
| Immigrants | Asia | 99.9 /100 | #53 | Exceptional 44.3% |
| Immigrants | Austria | 99.9 /100 | #54 | Exceptional 44.2% |