Immigrants from Syria vs German 11th Grade
COMPARE
Immigrants from Syria
German
11th Grade
11th Grade Comparison
Immigrants from Syria
Germans
92.3%
11TH GRADE
30.4/ 100
METRIC RATING
192nd/ 347
METRIC RANK
94.7%
11TH GRADE
100.0/ 100
METRIC RATING
11th/ 347
METRIC RANK
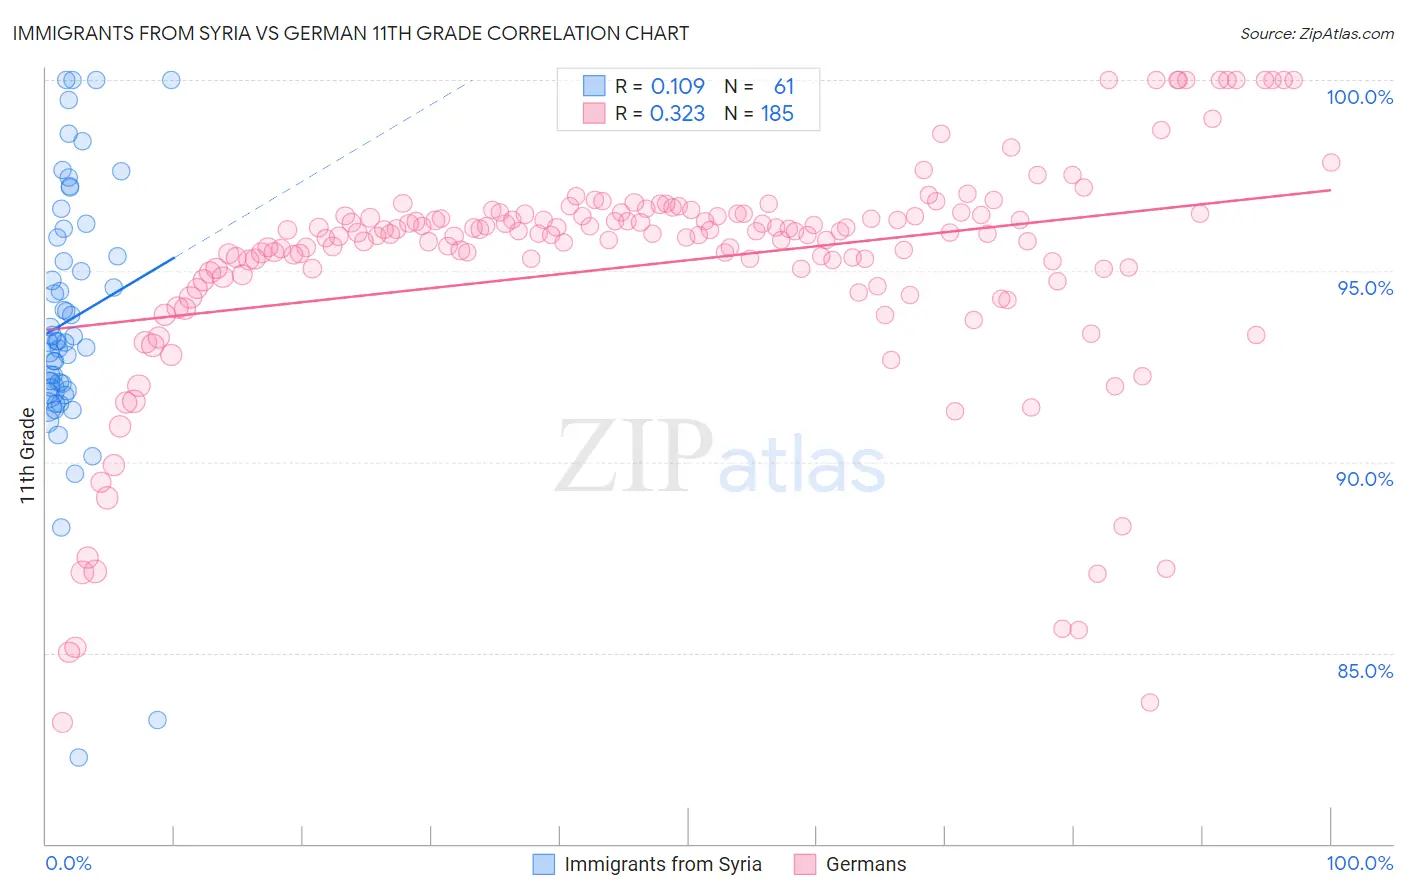
Immigrants from Syria vs German 11th Grade Correlation Chart
The statistical analysis conducted on geographies consisting of 174,108,882 people shows a poor positive correlation between the proportion of Immigrants from Syria and percentage of population with at least 11th grade education in the United States with a correlation coefficient (R) of 0.109 and weighted average of 92.3%. Similarly, the statistical analysis conducted on geographies consisting of 558,071,623 people shows a mild positive correlation between the proportion of Germans and percentage of population with at least 11th grade education in the United States with a correlation coefficient (R) of 0.323 and weighted average of 94.7%, a difference of 2.5%.
11th Grade Correlation Summary
| Measurement | Immigrants from Syria | German |
| Minimum | 82.3% | 83.2% |
| Maximum | 100.0% | 100.0% |
| Range | 17.7% | 16.8% |
| Mean | 93.7% | 95.2% |
| Median | 93.2% | 96.0% |
| Interquartile 25% (IQ1) | 91.9% | 94.9% |
| Interquartile 75% (IQ3) | 96.0% | 96.5% |
| Interquartile Range (IQR) | 4.1% | 1.5% |
| Standard Deviation (Sample) | 3.5% | 3.1% |
| Standard Deviation (Population) | 3.4% | 3.1% |
Similar Demographics by 11th Grade
Demographics Similar to Immigrants from Syria by 11th Grade
In terms of 11th grade, the demographic groups most similar to Immigrants from Syria are French American Indian (92.3%, a difference of 0.0%), Chickasaw (92.3%, a difference of 0.010%), Moroccan (92.3%, a difference of 0.020%), Sioux (92.3%, a difference of 0.020%), and Immigrants from Chile (92.4%, a difference of 0.030%).
| Demographics | Rating | Rank | 11th Grade |
| Immigrants | Nepal | 36.4 /100 | #185 | Fair 92.4% |
| Arapaho | 35.1 /100 | #186 | Fair 92.4% |
| Immigrants | Western Asia | 35.0 /100 | #187 | Fair 92.4% |
| Immigrants | Indonesia | 33.7 /100 | #188 | Fair 92.4% |
| Immigrants | Chile | 33.3 /100 | #189 | Fair 92.4% |
| Chickasaw | 31.4 /100 | #190 | Fair 92.3% |
| French American Indians | 30.8 /100 | #191 | Fair 92.3% |
| Immigrants | Syria | 30.4 /100 | #192 | Fair 92.3% |
| Moroccans | 28.7 /100 | #193 | Fair 92.3% |
| Sioux | 28.5 /100 | #194 | Fair 92.3% |
| Liberians | 26.8 /100 | #195 | Fair 92.3% |
| Panamanians | 26.4 /100 | #196 | Fair 92.3% |
| Marshallese | 26.0 /100 | #197 | Fair 92.3% |
| Hawaiians | 25.5 /100 | #198 | Fair 92.3% |
| Immigrants | Uganda | 25.2 /100 | #199 | Fair 92.3% |
Demographics Similar to Germans by 11th Grade
In terms of 11th grade, the demographic groups most similar to Germans are Finnish (94.7%, a difference of 0.0%), Latvian (94.7%, a difference of 0.0%), Chinese (94.6%, a difference of 0.030%), Danish (94.7%, a difference of 0.050%), and Croatian (94.7%, a difference of 0.090%).
| Demographics | Rating | Rank | 11th Grade |
| Slovaks | 100.0 /100 | #4 | Exceptional 94.9% |
| Carpatho Rusyns | 100.0 /100 | #5 | Exceptional 94.8% |
| Lithuanians | 100.0 /100 | #6 | Exceptional 94.8% |
| Poles | 100.0 /100 | #7 | Exceptional 94.8% |
| Croatians | 100.0 /100 | #8 | Exceptional 94.7% |
| Danes | 100.0 /100 | #9 | Exceptional 94.7% |
| Finns | 100.0 /100 | #10 | Exceptional 94.7% |
| Germans | 100.0 /100 | #11 | Exceptional 94.7% |
| Latvians | 100.0 /100 | #12 | Exceptional 94.7% |
| Chinese | 100.0 /100 | #13 | Exceptional 94.6% |
| Eastern Europeans | 100.0 /100 | #14 | Exceptional 94.6% |
| Bulgarians | 100.0 /100 | #15 | Exceptional 94.5% |
| Immigrants | India | 100.0 /100 | #16 | Exceptional 94.5% |
| Luxembourgers | 100.0 /100 | #17 | Exceptional 94.5% |
| Maltese | 100.0 /100 | #18 | Exceptional 94.5% |