Immigrants from Syria vs Indian (Asian) 11th Grade
COMPARE
Immigrants from Syria
Indian (Asian)
11th Grade
11th Grade Comparison
Immigrants from Syria
Indians (Asian)
92.3%
11TH GRADE
30.4/ 100
METRIC RATING
192nd/ 347
METRIC RANK
92.5%
11TH GRADE
51.5/ 100
METRIC RATING
173rd/ 347
METRIC RANK
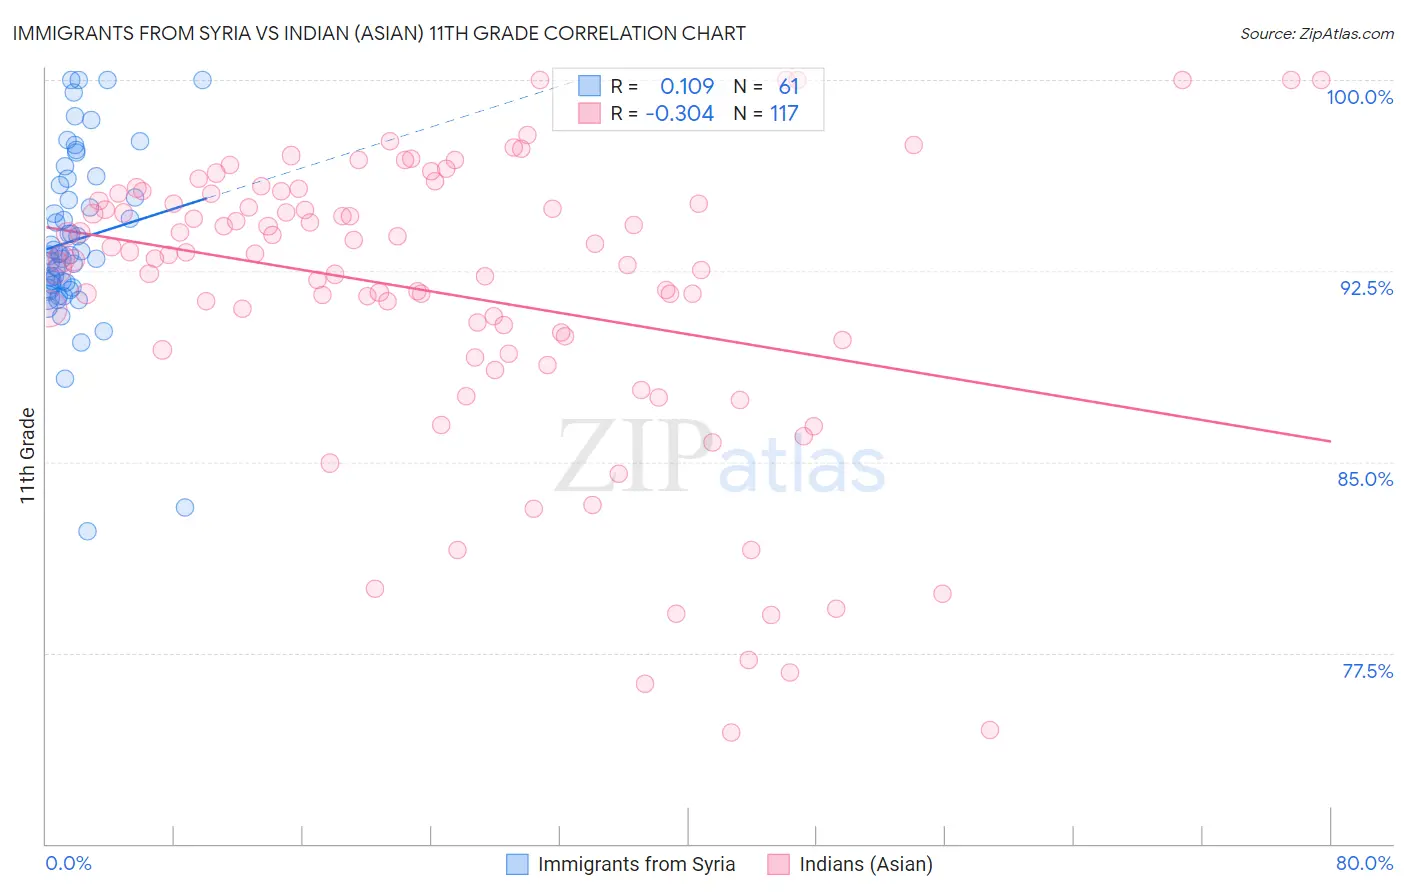
Immigrants from Syria vs Indian (Asian) 11th Grade Correlation Chart
The statistical analysis conducted on geographies consisting of 174,108,882 people shows a poor positive correlation between the proportion of Immigrants from Syria and percentage of population with at least 11th grade education in the United States with a correlation coefficient (R) of 0.109 and weighted average of 92.3%. Similarly, the statistical analysis conducted on geographies consisting of 495,348,182 people shows a mild negative correlation between the proportion of Indians (Asian) and percentage of population with at least 11th grade education in the United States with a correlation coefficient (R) of -0.304 and weighted average of 92.5%, a difference of 0.22%.
11th Grade Correlation Summary
| Measurement | Immigrants from Syria | Indian (Asian) |
| Minimum | 82.3% | 74.4% |
| Maximum | 100.0% | 100.0% |
| Range | 17.7% | 25.6% |
| Mean | 93.7% | 91.6% |
| Median | 93.2% | 93.1% |
| Interquartile 25% (IQ1) | 91.9% | 89.6% |
| Interquartile 75% (IQ3) | 96.0% | 95.4% |
| Interquartile Range (IQR) | 4.1% | 5.8% |
| Standard Deviation (Sample) | 3.5% | 5.8% |
| Standard Deviation (Population) | 3.4% | 5.8% |
Demographics Similar to Immigrants from Syria and Indians (Asian) by 11th Grade
In terms of 11th grade, the demographic groups most similar to Immigrants from Syria are French American Indian (92.3%, a difference of 0.0%), Chickasaw (92.3%, a difference of 0.010%), Immigrants from Chile (92.4%, a difference of 0.030%), Immigrants from Indonesia (92.4%, a difference of 0.040%), and Arapaho (92.4%, a difference of 0.050%). Similarly, the demographic groups most similar to Indians (Asian) are Immigrants from Pakistan (92.5%, a difference of 0.010%), Asian (92.5%, a difference of 0.020%), Shoshone (92.5%, a difference of 0.030%), Spaniard (92.5%, a difference of 0.050%), and Guamanian/Chamorro (92.5%, a difference of 0.060%).
| Demographics | Rating | Rank | 11th Grade |
| Immigrants | Pakistan | 52.3 /100 | #172 | Average 92.5% |
| Indians (Asian) | 51.5 /100 | #173 | Average 92.5% |
| Asians | 50.0 /100 | #174 | Average 92.5% |
| Shoshone | 48.9 /100 | #175 | Average 92.5% |
| Spaniards | 46.9 /100 | #176 | Average 92.5% |
| Guamanians/Chamorros | 45.0 /100 | #177 | Average 92.5% |
| Sudanese | 43.4 /100 | #178 | Average 92.5% |
| Creek | 40.9 /100 | #179 | Average 92.4% |
| Inupiat | 40.7 /100 | #180 | Average 92.4% |
| Cherokee | 40.7 /100 | #181 | Average 92.4% |
| Immigrants | Morocco | 38.6 /100 | #182 | Fair 92.4% |
| Immigrants | Malaysia | 37.6 /100 | #183 | Fair 92.4% |
| Immigrants | Asia | 37.4 /100 | #184 | Fair 92.4% |
| Immigrants | Nepal | 36.4 /100 | #185 | Fair 92.4% |
| Arapaho | 35.1 /100 | #186 | Fair 92.4% |
| Immigrants | Western Asia | 35.0 /100 | #187 | Fair 92.4% |
| Immigrants | Indonesia | 33.7 /100 | #188 | Fair 92.4% |
| Immigrants | Chile | 33.3 /100 | #189 | Fair 92.4% |
| Chickasaw | 31.4 /100 | #190 | Fair 92.3% |
| French American Indians | 30.8 /100 | #191 | Fair 92.3% |
| Immigrants | Syria | 30.4 /100 | #192 | Fair 92.3% |