Immigrants from Peru vs German 11th Grade
COMPARE
Immigrants from Peru
German
11th Grade
11th Grade Comparison
Immigrants from Peru
Germans
91.0%
11TH GRADE
0.1/ 100
METRIC RATING
271st/ 347
METRIC RANK
94.7%
11TH GRADE
100.0/ 100
METRIC RATING
11th/ 347
METRIC RANK
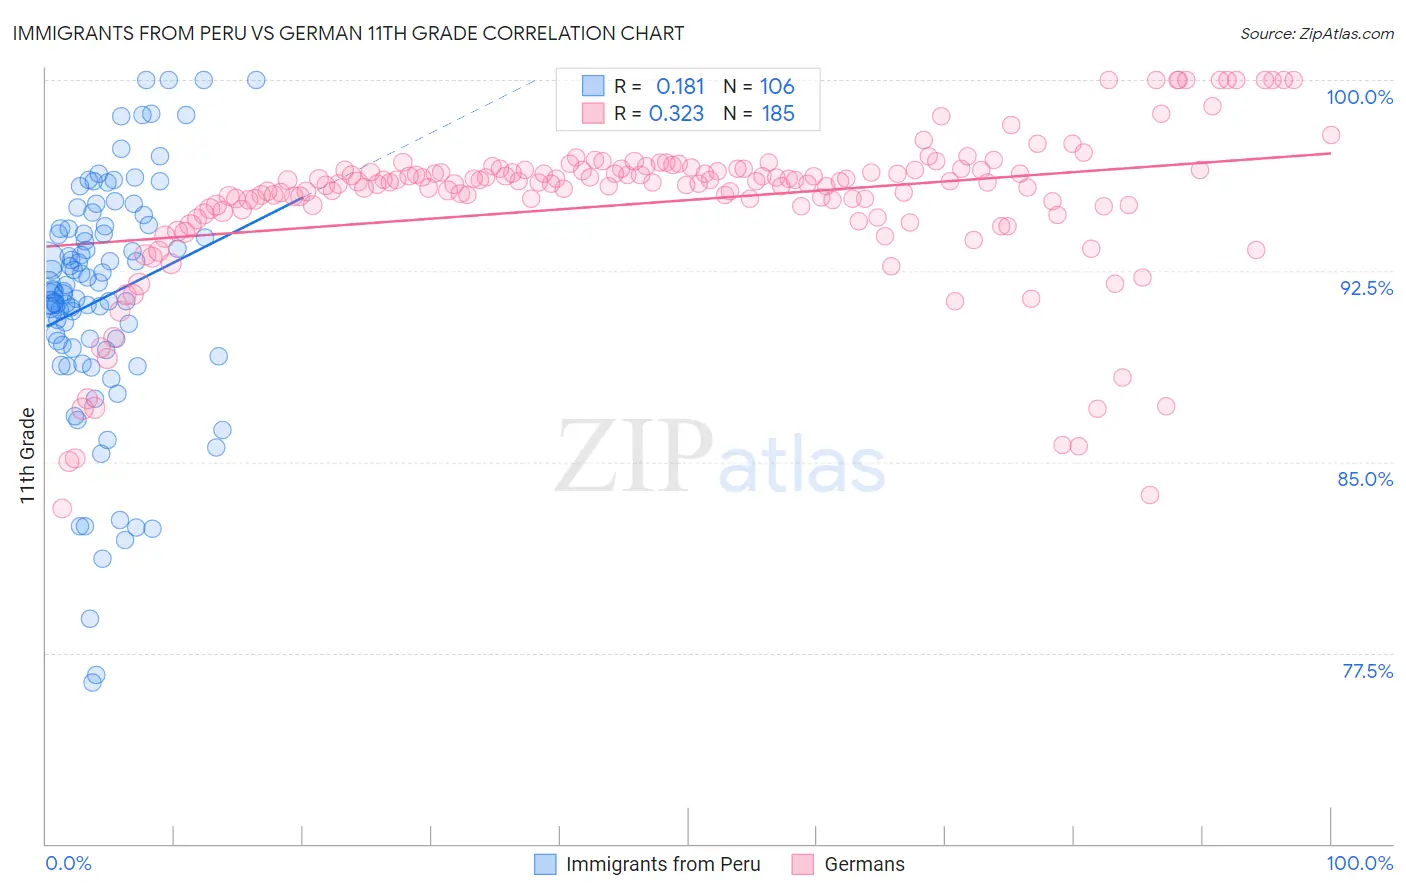
Immigrants from Peru vs German 11th Grade Correlation Chart
The statistical analysis conducted on geographies consisting of 328,860,880 people shows a poor positive correlation between the proportion of Immigrants from Peru and percentage of population with at least 11th grade education in the United States with a correlation coefficient (R) of 0.181 and weighted average of 91.0%. Similarly, the statistical analysis conducted on geographies consisting of 558,071,623 people shows a mild positive correlation between the proportion of Germans and percentage of population with at least 11th grade education in the United States with a correlation coefficient (R) of 0.323 and weighted average of 94.7%, a difference of 4.0%.
11th Grade Correlation Summary
| Measurement | Immigrants from Peru | German |
| Minimum | 76.3% | 83.2% |
| Maximum | 100.0% | 100.0% |
| Range | 23.7% | 16.8% |
| Mean | 91.4% | 95.2% |
| Median | 91.7% | 96.0% |
| Interquartile 25% (IQ1) | 89.5% | 94.9% |
| Interquartile 75% (IQ3) | 94.2% | 96.5% |
| Interquartile Range (IQR) | 4.7% | 1.5% |
| Standard Deviation (Sample) | 4.8% | 3.1% |
| Standard Deviation (Population) | 4.7% | 3.1% |
Similar Demographics by 11th Grade
Demographics Similar to Immigrants from Peru by 11th Grade
In terms of 11th grade, the demographic groups most similar to Immigrants from Peru are West Indian (91.0%, a difference of 0.0%), Trinidadian and Tobagonian (91.1%, a difference of 0.030%), Paiute (91.0%, a difference of 0.050%), Ute (91.1%, a difference of 0.060%), and U.S. Virgin Islander (91.1%, a difference of 0.090%).
| Demographics | Rating | Rank | 11th Grade |
| Yup'ik | 0.3 /100 | #264 | Tragic 91.2% |
| Pueblo | 0.3 /100 | #265 | Tragic 91.2% |
| Immigrants | Western Africa | 0.3 /100 | #266 | Tragic 91.2% |
| Immigrants | Jamaica | 0.3 /100 | #267 | Tragic 91.2% |
| U.S. Virgin Islanders | 0.2 /100 | #268 | Tragic 91.1% |
| Ute | 0.2 /100 | #269 | Tragic 91.1% |
| Trinidadians and Tobagonians | 0.2 /100 | #270 | Tragic 91.1% |
| Immigrants | Peru | 0.1 /100 | #271 | Tragic 91.0% |
| West Indians | 0.1 /100 | #272 | Tragic 91.0% |
| Paiute | 0.1 /100 | #273 | Tragic 91.0% |
| Immigrants | Trinidad and Tobago | 0.1 /100 | #274 | Tragic 90.9% |
| Immigrants | South Eastern Asia | 0.1 /100 | #275 | Tragic 90.9% |
| Bangladeshis | 0.1 /100 | #276 | Tragic 90.9% |
| Immigrants | Congo | 0.1 /100 | #277 | Tragic 90.9% |
| Malaysians | 0.1 /100 | #278 | Tragic 90.8% |
Demographics Similar to Germans by 11th Grade
In terms of 11th grade, the demographic groups most similar to Germans are Finnish (94.7%, a difference of 0.0%), Latvian (94.7%, a difference of 0.0%), Chinese (94.6%, a difference of 0.030%), Danish (94.7%, a difference of 0.050%), and Croatian (94.7%, a difference of 0.090%).
| Demographics | Rating | Rank | 11th Grade |
| Slovaks | 100.0 /100 | #4 | Exceptional 94.9% |
| Carpatho Rusyns | 100.0 /100 | #5 | Exceptional 94.8% |
| Lithuanians | 100.0 /100 | #6 | Exceptional 94.8% |
| Poles | 100.0 /100 | #7 | Exceptional 94.8% |
| Croatians | 100.0 /100 | #8 | Exceptional 94.7% |
| Danes | 100.0 /100 | #9 | Exceptional 94.7% |
| Finns | 100.0 /100 | #10 | Exceptional 94.7% |
| Germans | 100.0 /100 | #11 | Exceptional 94.7% |
| Latvians | 100.0 /100 | #12 | Exceptional 94.7% |
| Chinese | 100.0 /100 | #13 | Exceptional 94.6% |
| Eastern Europeans | 100.0 /100 | #14 | Exceptional 94.6% |
| Bulgarians | 100.0 /100 | #15 | Exceptional 94.5% |
| Immigrants | India | 100.0 /100 | #16 | Exceptional 94.5% |
| Luxembourgers | 100.0 /100 | #17 | Exceptional 94.5% |
| Maltese | 100.0 /100 | #18 | Exceptional 94.5% |