Immigrants from Switzerland vs South American 1st Grade
COMPARE
Immigrants from Switzerland
South American
1st Grade
1st Grade Comparison
Immigrants from Switzerland
South Americans
98.2%
1ST GRADE
97.3/ 100
METRIC RATING
107th/ 347
METRIC RANK
97.6%
1ST GRADE
1.1/ 100
METRIC RATING
245th/ 347
METRIC RANK
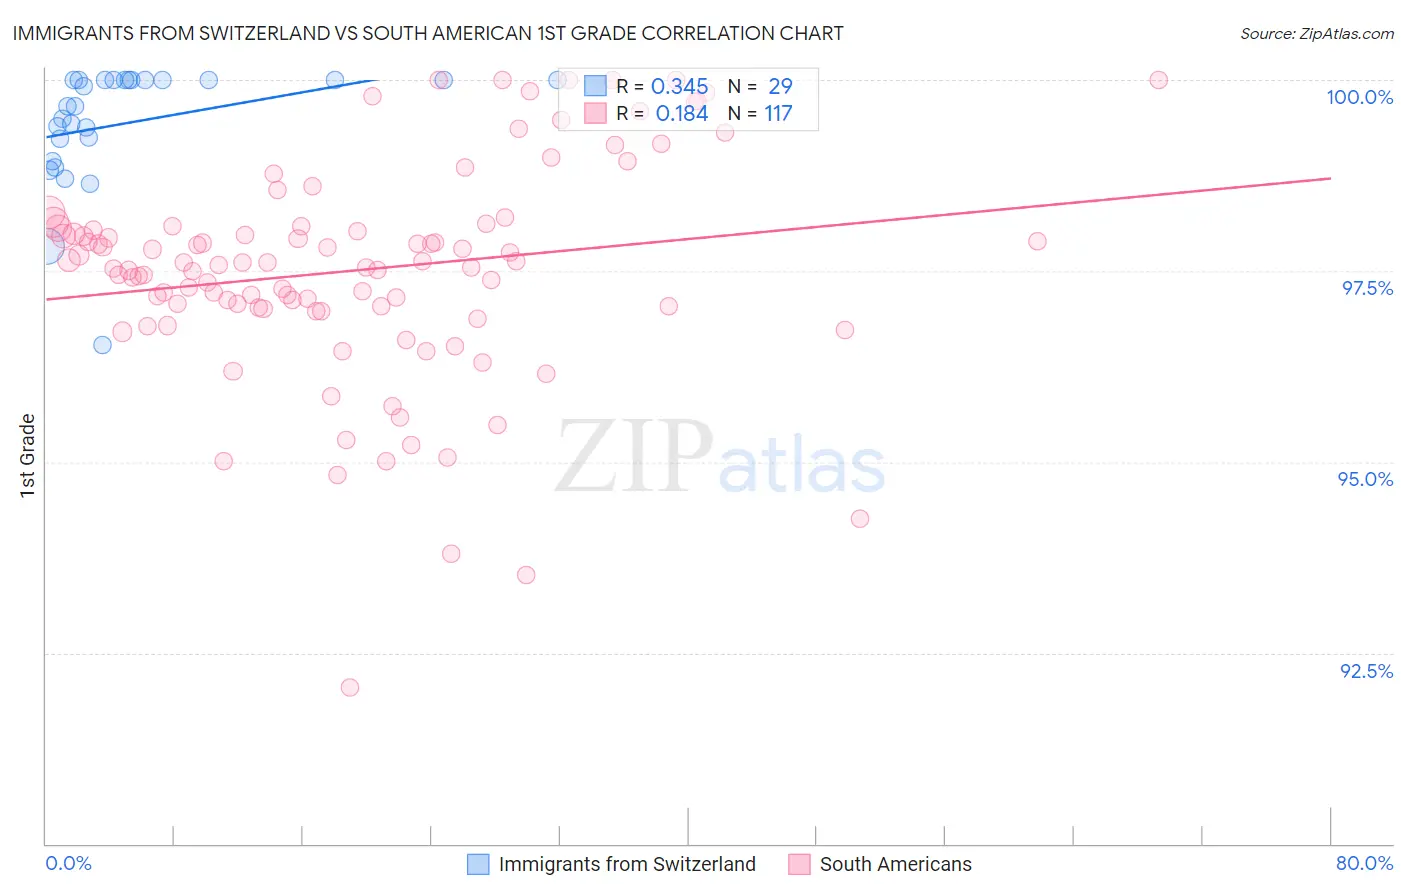
Immigrants from Switzerland vs South American 1st Grade Correlation Chart
The statistical analysis conducted on geographies consisting of 148,082,451 people shows a mild positive correlation between the proportion of Immigrants from Switzerland and percentage of population with at least 1st grade education in the United States with a correlation coefficient (R) of 0.345 and weighted average of 98.2%. Similarly, the statistical analysis conducted on geographies consisting of 494,178,447 people shows a poor positive correlation between the proportion of South Americans and percentage of population with at least 1st grade education in the United States with a correlation coefficient (R) of 0.184 and weighted average of 97.6%, a difference of 0.63%.
1st Grade Correlation Summary
| Measurement | Immigrants from Switzerland | South American |
| Minimum | 96.5% | 92.1% |
| Maximum | 100.0% | 100.0% |
| Range | 3.5% | 7.9% |
| Mean | 99.4% | 97.5% |
| Median | 99.7% | 97.6% |
| Interquartile 25% (IQ1) | 99.1% | 97.0% |
| Interquartile 75% (IQ3) | 100.0% | 98.1% |
| Interquartile Range (IQR) | 0.91% | 1.1% |
| Standard Deviation (Sample) | 0.79% | 1.4% |
| Standard Deviation (Population) | 0.78% | 1.4% |
Similar Demographics by 1st Grade
Demographics Similar to Immigrants from Switzerland by 1st Grade
In terms of 1st grade, the demographic groups most similar to Immigrants from Switzerland are Basque (98.2%, a difference of 0.0%), Turkish (98.2%, a difference of 0.0%), Bhutanese (98.2%, a difference of 0.0%), German Russian (98.2%, a difference of 0.0%), and Immigrants from Ireland (98.2%, a difference of 0.010%).
| Demographics | Rating | Rank | 1st Grade |
| Colville | 98.0 /100 | #100 | Exceptional 98.2% |
| Romanians | 97.8 /100 | #101 | Exceptional 98.2% |
| Cree | 97.8 /100 | #102 | Exceptional 98.2% |
| Immigrants | Ireland | 97.7 /100 | #103 | Exceptional 98.2% |
| Pima | 97.5 /100 | #104 | Exceptional 98.2% |
| Basques | 97.4 /100 | #105 | Exceptional 98.2% |
| Turks | 97.4 /100 | #106 | Exceptional 98.2% |
| Immigrants | Switzerland | 97.3 /100 | #107 | Exceptional 98.2% |
| Bhutanese | 97.3 /100 | #108 | Exceptional 98.2% |
| German Russians | 97.1 /100 | #109 | Exceptional 98.2% |
| Immigrants | Singapore | 96.7 /100 | #110 | Exceptional 98.2% |
| Immigrants | Czechoslovakia | 96.6 /100 | #111 | Exceptional 98.2% |
| Immigrants | Norway | 96.6 /100 | #112 | Exceptional 98.2% |
| Immigrants | Latvia | 96.4 /100 | #113 | Exceptional 98.2% |
| Ute | 96.2 /100 | #114 | Exceptional 98.2% |
Demographics Similar to South Americans by 1st Grade
In terms of 1st grade, the demographic groups most similar to South Americans are Asian (97.6%, a difference of 0.0%), Immigrants from Eastern Africa (97.6%, a difference of 0.0%), Peruvian (97.6%, a difference of 0.0%), Immigrants from Middle Africa (97.6%, a difference of 0.0%), and Immigrants from Indonesia (97.6%, a difference of 0.010%).
| Demographics | Rating | Rank | 1st Grade |
| Nigerians | 1.8 /100 | #238 | Tragic 97.6% |
| Immigrants | Eastern Asia | 1.6 /100 | #239 | Tragic 97.6% |
| Koreans | 1.5 /100 | #240 | Tragic 97.6% |
| Liberians | 1.4 /100 | #241 | Tragic 97.6% |
| Immigrants | Indonesia | 1.2 /100 | #242 | Tragic 97.6% |
| Bolivians | 1.2 /100 | #243 | Tragic 97.6% |
| Asians | 1.1 /100 | #244 | Tragic 97.6% |
| South Americans | 1.1 /100 | #245 | Tragic 97.6% |
| Immigrants | Eastern Africa | 1.0 /100 | #246 | Tragic 97.6% |
| Peruvians | 1.0 /100 | #247 | Tragic 97.6% |
| Immigrants | Middle Africa | 1.0 /100 | #248 | Tragic 97.6% |
| Immigrants | Senegal | 1.0 /100 | #249 | Tragic 97.6% |
| Ethiopians | 0.9 /100 | #250 | Tragic 97.6% |
| Immigrants | Iraq | 0.9 /100 | #251 | Tragic 97.6% |
| Immigrants | Africa | 0.9 /100 | #252 | Tragic 97.6% |