Immigrants from Switzerland vs Barbadian 1st Grade
COMPARE
Immigrants from Switzerland
Barbadian
1st Grade
1st Grade Comparison
Immigrants from Switzerland
Barbadians
98.2%
1ST GRADE
97.3/ 100
METRIC RATING
107th/ 347
METRIC RANK
97.3%
1ST GRADE
0.1/ 100
METRIC RATING
282nd/ 347
METRIC RANK
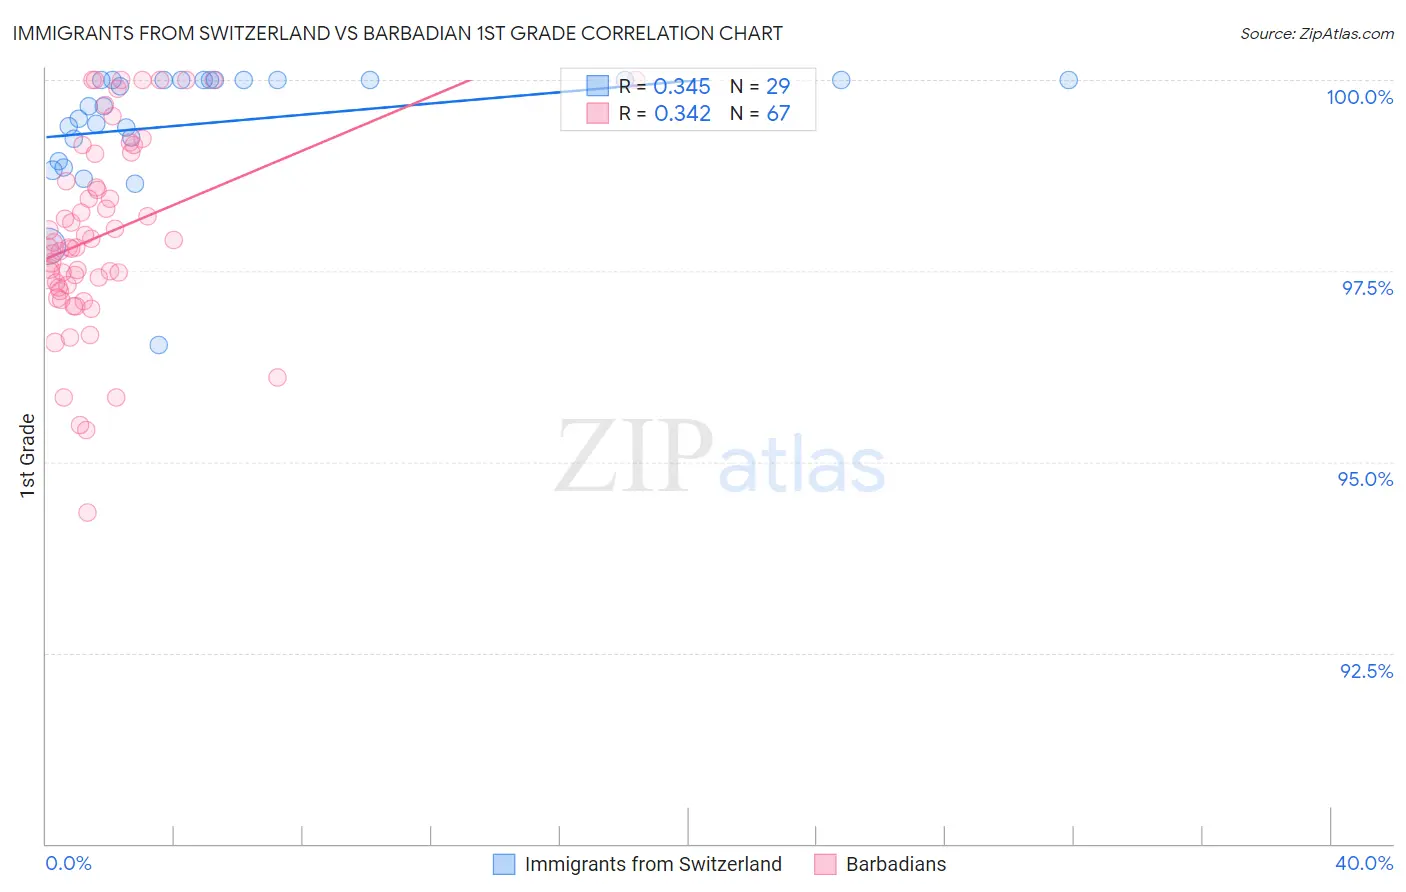
Immigrants from Switzerland vs Barbadian 1st Grade Correlation Chart
The statistical analysis conducted on geographies consisting of 148,082,451 people shows a mild positive correlation between the proportion of Immigrants from Switzerland and percentage of population with at least 1st grade education in the United States with a correlation coefficient (R) of 0.345 and weighted average of 98.2%. Similarly, the statistical analysis conducted on geographies consisting of 141,304,590 people shows a mild positive correlation between the proportion of Barbadians and percentage of population with at least 1st grade education in the United States with a correlation coefficient (R) of 0.342 and weighted average of 97.3%, a difference of 0.87%.
1st Grade Correlation Summary
| Measurement | Immigrants from Switzerland | Barbadian |
| Minimum | 96.5% | 94.3% |
| Maximum | 100.0% | 100.0% |
| Range | 3.5% | 5.7% |
| Mean | 99.4% | 98.0% |
| Median | 99.7% | 97.8% |
| Interquartile 25% (IQ1) | 99.1% | 97.3% |
| Interquartile 75% (IQ3) | 100.0% | 99.0% |
| Interquartile Range (IQR) | 0.91% | 1.7% |
| Standard Deviation (Sample) | 0.79% | 1.3% |
| Standard Deviation (Population) | 0.78% | 1.3% |
Similar Demographics by 1st Grade
Demographics Similar to Immigrants from Switzerland by 1st Grade
In terms of 1st grade, the demographic groups most similar to Immigrants from Switzerland are Basque (98.2%, a difference of 0.0%), Turkish (98.2%, a difference of 0.0%), Bhutanese (98.2%, a difference of 0.0%), German Russian (98.2%, a difference of 0.0%), and Immigrants from Ireland (98.2%, a difference of 0.010%).
| Demographics | Rating | Rank | 1st Grade |
| Colville | 98.0 /100 | #100 | Exceptional 98.2% |
| Romanians | 97.8 /100 | #101 | Exceptional 98.2% |
| Cree | 97.8 /100 | #102 | Exceptional 98.2% |
| Immigrants | Ireland | 97.7 /100 | #103 | Exceptional 98.2% |
| Pima | 97.5 /100 | #104 | Exceptional 98.2% |
| Basques | 97.4 /100 | #105 | Exceptional 98.2% |
| Turks | 97.4 /100 | #106 | Exceptional 98.2% |
| Immigrants | Switzerland | 97.3 /100 | #107 | Exceptional 98.2% |
| Bhutanese | 97.3 /100 | #108 | Exceptional 98.2% |
| German Russians | 97.1 /100 | #109 | Exceptional 98.2% |
| Immigrants | Singapore | 96.7 /100 | #110 | Exceptional 98.2% |
| Immigrants | Czechoslovakia | 96.6 /100 | #111 | Exceptional 98.2% |
| Immigrants | Norway | 96.6 /100 | #112 | Exceptional 98.2% |
| Immigrants | Latvia | 96.4 /100 | #113 | Exceptional 98.2% |
| Ute | 96.2 /100 | #114 | Exceptional 98.2% |
Demographics Similar to Barbadians by 1st Grade
In terms of 1st grade, the demographic groups most similar to Barbadians are Afghan (97.4%, a difference of 0.0%), Trinidadian and Tobagonian (97.3%, a difference of 0.0%), Immigrants from Uzbekistan (97.4%, a difference of 0.010%), Immigrants from Ghana (97.4%, a difference of 0.010%), and Immigrants from Western Africa (97.4%, a difference of 0.030%).
| Demographics | Rating | Rank | 1st Grade |
| Immigrants | China | 0.1 /100 | #275 | Tragic 97.4% |
| Immigrants | Philippines | 0.1 /100 | #276 | Tragic 97.4% |
| Immigrants | Western Africa | 0.1 /100 | #277 | Tragic 97.4% |
| Immigrants | Uzbekistan | 0.1 /100 | #278 | Tragic 97.4% |
| Immigrants | Ghana | 0.1 /100 | #279 | Tragic 97.4% |
| Afghans | 0.1 /100 | #280 | Tragic 97.4% |
| Trinidadians and Tobagonians | 0.1 /100 | #281 | Tragic 97.3% |
| Barbadians | 0.1 /100 | #282 | Tragic 97.3% |
| Immigrants | West Indies | 0.0 /100 | #283 | Tragic 97.3% |
| Immigrants | Trinidad and Tobago | 0.0 /100 | #284 | Tragic 97.3% |
| Immigrants | Portugal | 0.0 /100 | #285 | Tragic 97.3% |
| Immigrants | Barbados | 0.0 /100 | #286 | Tragic 97.3% |
| Immigrants | Hong Kong | 0.0 /100 | #287 | Tragic 97.3% |
| Immigrants | Thailand | 0.0 /100 | #288 | Tragic 97.3% |
| Immigrants | Afghanistan | 0.0 /100 | #289 | Tragic 97.3% |