Immigrants from Switzerland vs Aleut 1st Grade
COMPARE
Immigrants from Switzerland
Aleut
1st Grade
1st Grade Comparison
Immigrants from Switzerland
Aleuts
98.2%
1ST GRADE
97.3/ 100
METRIC RATING
107th/ 347
METRIC RANK
98.6%
1ST GRADE
100.0/ 100
METRIC RATING
16th/ 347
METRIC RANK
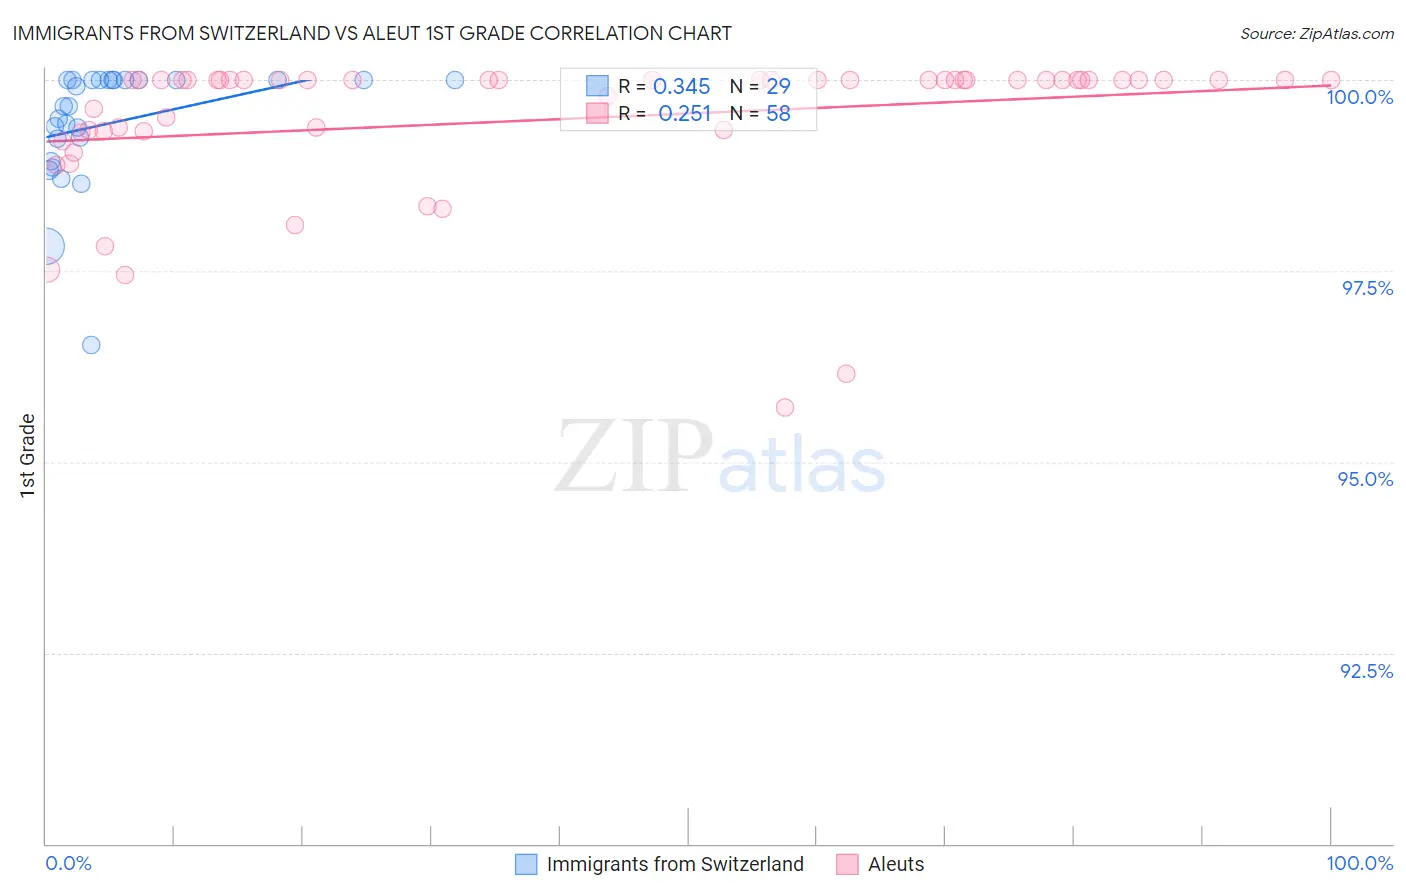
Immigrants from Switzerland vs Aleut 1st Grade Correlation Chart
The statistical analysis conducted on geographies consisting of 148,082,451 people shows a mild positive correlation between the proportion of Immigrants from Switzerland and percentage of population with at least 1st grade education in the United States with a correlation coefficient (R) of 0.345 and weighted average of 98.2%. Similarly, the statistical analysis conducted on geographies consisting of 61,781,127 people shows a weak positive correlation between the proportion of Aleuts and percentage of population with at least 1st grade education in the United States with a correlation coefficient (R) of 0.251 and weighted average of 98.6%, a difference of 0.43%.
1st Grade Correlation Summary
| Measurement | Immigrants from Switzerland | Aleut |
| Minimum | 96.5% | 95.7% |
| Maximum | 100.0% | 100.0% |
| Range | 3.5% | 4.3% |
| Mean | 99.4% | 99.5% |
| Median | 99.7% | 100.0% |
| Interquartile 25% (IQ1) | 99.1% | 99.3% |
| Interquartile 75% (IQ3) | 100.0% | 100.0% |
| Interquartile Range (IQR) | 0.91% | 0.67% |
| Standard Deviation (Sample) | 0.79% | 0.95% |
| Standard Deviation (Population) | 0.78% | 0.94% |
Similar Demographics by 1st Grade
Demographics Similar to Immigrants from Switzerland by 1st Grade
In terms of 1st grade, the demographic groups most similar to Immigrants from Switzerland are Basque (98.2%, a difference of 0.0%), Turkish (98.2%, a difference of 0.0%), Bhutanese (98.2%, a difference of 0.0%), German Russian (98.2%, a difference of 0.0%), and Immigrants from Ireland (98.2%, a difference of 0.010%).
| Demographics | Rating | Rank | 1st Grade |
| Colville | 98.0 /100 | #100 | Exceptional 98.2% |
| Romanians | 97.8 /100 | #101 | Exceptional 98.2% |
| Cree | 97.8 /100 | #102 | Exceptional 98.2% |
| Immigrants | Ireland | 97.7 /100 | #103 | Exceptional 98.2% |
| Pima | 97.5 /100 | #104 | Exceptional 98.2% |
| Basques | 97.4 /100 | #105 | Exceptional 98.2% |
| Turks | 97.4 /100 | #106 | Exceptional 98.2% |
| Immigrants | Switzerland | 97.3 /100 | #107 | Exceptional 98.2% |
| Bhutanese | 97.3 /100 | #108 | Exceptional 98.2% |
| German Russians | 97.1 /100 | #109 | Exceptional 98.2% |
| Immigrants | Singapore | 96.7 /100 | #110 | Exceptional 98.2% |
| Immigrants | Czechoslovakia | 96.6 /100 | #111 | Exceptional 98.2% |
| Immigrants | Norway | 96.6 /100 | #112 | Exceptional 98.2% |
| Immigrants | Latvia | 96.4 /100 | #113 | Exceptional 98.2% |
| Ute | 96.2 /100 | #114 | Exceptional 98.2% |
Demographics Similar to Aleuts by 1st Grade
In terms of 1st grade, the demographic groups most similar to Aleuts are Scottish (98.6%, a difference of 0.0%), Swedish (98.6%, a difference of 0.010%), Dutch (98.6%, a difference of 0.010%), Carpatho Rusyn (98.6%, a difference of 0.030%), and English (98.6%, a difference of 0.030%).
| Demographics | Rating | Rank | 1st Grade |
| Slovaks | 100.0 /100 | #9 | Exceptional 98.7% |
| Germans | 100.0 /100 | #10 | Exceptional 98.7% |
| Tlingit-Haida | 100.0 /100 | #11 | Exceptional 98.7% |
| Slovenes | 100.0 /100 | #12 | Exceptional 98.7% |
| Carpatho Rusyns | 100.0 /100 | #13 | Exceptional 98.6% |
| English | 100.0 /100 | #14 | Exceptional 98.6% |
| Swedes | 100.0 /100 | #15 | Exceptional 98.6% |
| Aleuts | 100.0 /100 | #16 | Exceptional 98.6% |
| Scottish | 100.0 /100 | #17 | Exceptional 98.6% |
| Dutch | 100.0 /100 | #18 | Exceptional 98.6% |
| Irish | 100.0 /100 | #19 | Exceptional 98.6% |
| Sioux | 100.0 /100 | #20 | Exceptional 98.6% |
| Arapaho | 100.0 /100 | #21 | Exceptional 98.6% |
| Pennsylvania Germans | 100.0 /100 | #22 | Exceptional 98.6% |
| Finns | 100.0 /100 | #23 | Exceptional 98.6% |