Immigrants from Sudan vs Czechoslovakian 2nd Grade
COMPARE
Immigrants from Sudan
Czechoslovakian
2nd Grade
2nd Grade Comparison
Immigrants from Sudan
Czechoslovakians
97.6%
2ND GRADE
4.5/ 100
METRIC RATING
222nd/ 347
METRIC RANK
98.4%
2ND GRADE
99.9/ 100
METRIC RATING
48th/ 347
METRIC RANK
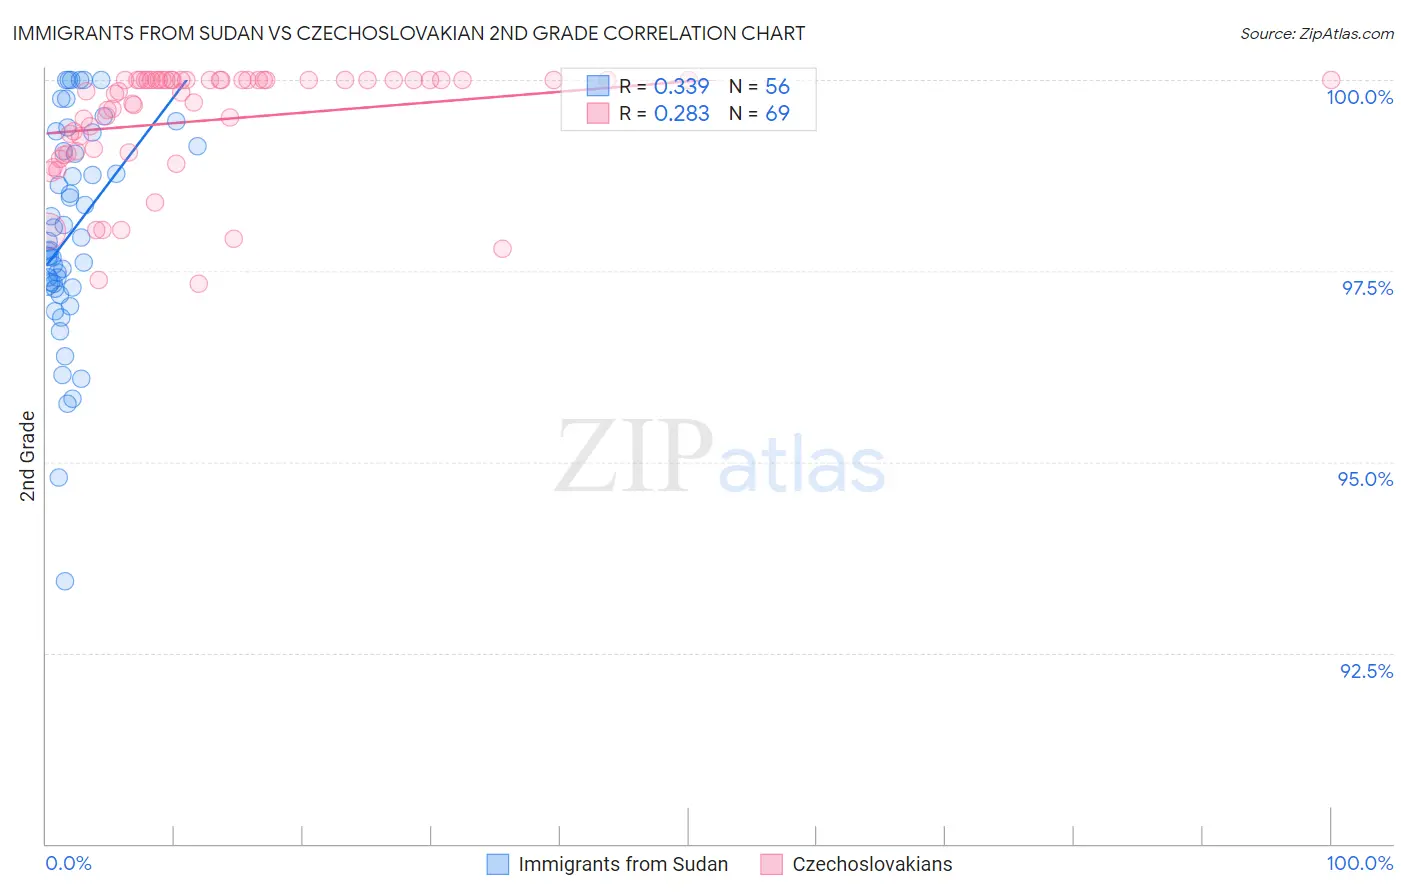
Immigrants from Sudan vs Czechoslovakian 2nd Grade Correlation Chart
The statistical analysis conducted on geographies consisting of 118,957,985 people shows a mild positive correlation between the proportion of Immigrants from Sudan and percentage of population with at least 2nd grade education in the United States with a correlation coefficient (R) of 0.339 and weighted average of 97.6%. Similarly, the statistical analysis conducted on geographies consisting of 368,668,876 people shows a weak positive correlation between the proportion of Czechoslovakians and percentage of population with at least 2nd grade education in the United States with a correlation coefficient (R) of 0.283 and weighted average of 98.4%, a difference of 0.76%.
2nd Grade Correlation Summary
| Measurement | Immigrants from Sudan | Czechoslovakian |
| Minimum | 93.4% | 97.3% |
| Maximum | 100.0% | 100.0% |
| Range | 6.6% | 2.7% |
| Mean | 98.0% | 99.5% |
| Median | 97.8% | 99.9% |
| Interquartile 25% (IQ1) | 97.3% | 99.1% |
| Interquartile 75% (IQ3) | 99.1% | 100.0% |
| Interquartile Range (IQR) | 1.8% | 0.94% |
| Standard Deviation (Sample) | 1.4% | 0.73% |
| Standard Deviation (Population) | 1.4% | 0.73% |
Similar Demographics by 2nd Grade
Demographics Similar to Immigrants from Sudan by 2nd Grade
In terms of 2nd grade, the demographic groups most similar to Immigrants from Sudan are Iraqi (97.6%, a difference of 0.0%), Sierra Leonean (97.6%, a difference of 0.0%), Immigrants from Zaire (97.6%, a difference of 0.0%), Tongan (97.6%, a difference of 0.0%), and Immigrants from Panama (97.6%, a difference of 0.010%).
| Demographics | Rating | Rank | 2nd Grade |
| Bahamians | 6.8 /100 | #215 | Tragic 97.7% |
| South American Indians | 6.7 /100 | #216 | Tragic 97.7% |
| Uruguayans | 6.2 /100 | #217 | Tragic 97.7% |
| Sudanese | 5.7 /100 | #218 | Tragic 97.7% |
| Immigrants | Panama | 5.1 /100 | #219 | Tragic 97.6% |
| Immigrants | Morocco | 5.0 /100 | #220 | Tragic 97.6% |
| Iraqis | 4.6 /100 | #221 | Tragic 97.6% |
| Immigrants | Sudan | 4.5 /100 | #222 | Tragic 97.6% |
| Sierra Leoneans | 4.3 /100 | #223 | Tragic 97.6% |
| Immigrants | Zaire | 4.3 /100 | #224 | Tragic 97.6% |
| Tongans | 4.3 /100 | #225 | Tragic 97.6% |
| Immigrants | Syria | 4.0 /100 | #226 | Tragic 97.6% |
| Immigrants | Nepal | 4.0 /100 | #227 | Tragic 97.6% |
| Sub-Saharan Africans | 3.4 /100 | #228 | Tragic 97.6% |
| Immigrants | Costa Rica | 3.1 /100 | #229 | Tragic 97.6% |
Demographics Similar to Czechoslovakians by 2nd Grade
In terms of 2nd grade, the demographic groups most similar to Czechoslovakians are Ottawa (98.4%, a difference of 0.0%), Lumbee (98.4%, a difference of 0.010%), Celtic (98.4%, a difference of 0.010%), White/Caucasian (98.4%, a difference of 0.010%), and Estonian (98.4%, a difference of 0.010%).
| Demographics | Rating | Rank | 2nd Grade |
| Eastern Europeans | 99.9 /100 | #41 | Exceptional 98.4% |
| Native Hawaiians | 99.9 /100 | #42 | Exceptional 98.4% |
| Belgians | 99.9 /100 | #43 | Exceptional 98.4% |
| Northern Europeans | 99.9 /100 | #44 | Exceptional 98.4% |
| Hungarians | 99.9 /100 | #45 | Exceptional 98.4% |
| Lumbee | 99.9 /100 | #46 | Exceptional 98.4% |
| Ottawa | 99.9 /100 | #47 | Exceptional 98.4% |
| Czechoslovakians | 99.9 /100 | #48 | Exceptional 98.4% |
| Celtics | 99.8 /100 | #49 | Exceptional 98.4% |
| Whites/Caucasians | 99.8 /100 | #50 | Exceptional 98.4% |
| Estonians | 99.8 /100 | #51 | Exceptional 98.4% |
| Australians | 99.8 /100 | #52 | Exceptional 98.4% |
| Pueblo | 99.8 /100 | #53 | Exceptional 98.3% |
| Kiowa | 99.8 /100 | #54 | Exceptional 98.3% |
| Immigrants | Scotland | 99.8 /100 | #55 | Exceptional 98.3% |