Osage vs Black/African American 6th Grade
COMPARE
Osage
Black/African American
6th Grade
6th Grade Comparison
Osage
Blacks/African Americans
97.6%
6TH GRADE
99.3/ 100
METRIC RATING
80th/ 347
METRIC RANK
97.0%
6TH GRADE
30.2/ 100
METRIC RATING
189th/ 347
METRIC RANK
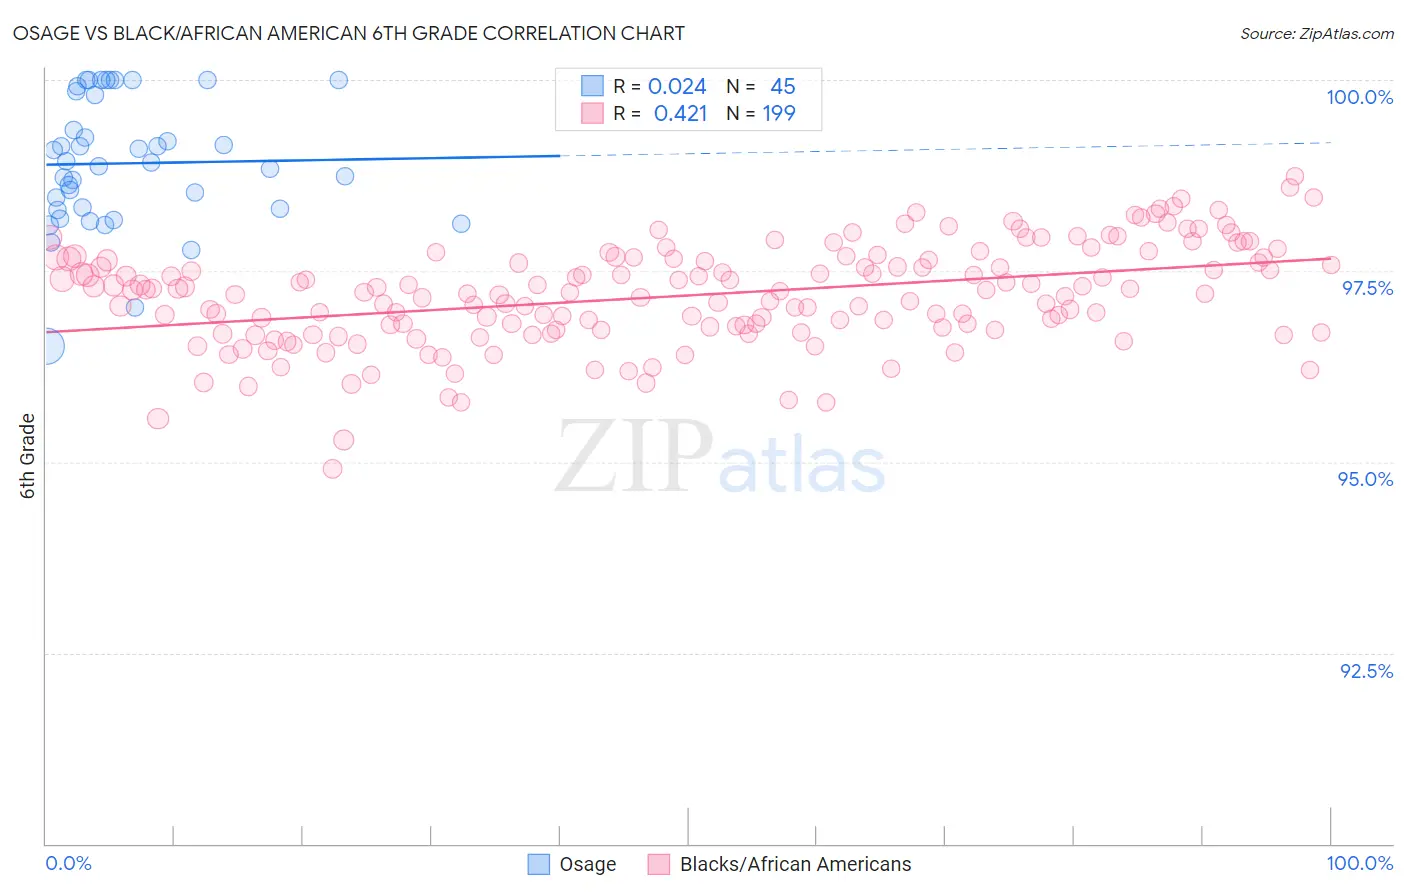
Osage vs Black/African American 6th Grade Correlation Chart
The statistical analysis conducted on geographies consisting of 91,808,929 people shows no correlation between the proportion of Osage and percentage of population with at least 6th grade education in the United States with a correlation coefficient (R) of 0.024 and weighted average of 97.6%. Similarly, the statistical analysis conducted on geographies consisting of 566,043,668 people shows a moderate positive correlation between the proportion of Blacks/African Americans and percentage of population with at least 6th grade education in the United States with a correlation coefficient (R) of 0.421 and weighted average of 97.0%, a difference of 0.66%.
6th Grade Correlation Summary
| Measurement | Osage | Black/African American |
| Minimum | 96.5% | 94.9% |
| Maximum | 100.0% | 98.7% |
| Range | 3.5% | 3.8% |
| Mean | 98.9% | 97.2% |
| Median | 98.9% | 97.2% |
| Interquartile 25% (IQ1) | 98.3% | 96.7% |
| Interquartile 75% (IQ3) | 99.8% | 97.7% |
| Interquartile Range (IQR) | 1.5% | 0.92% |
| Standard Deviation (Sample) | 0.84% | 0.66% |
| Standard Deviation (Population) | 0.83% | 0.66% |
Similar Demographics by 6th Grade
Demographics Similar to Osage by 6th Grade
In terms of 6th grade, the demographic groups most similar to Osage are Immigrants from India (97.6%, a difference of 0.0%), Immigrants from Lithuania (97.6%, a difference of 0.010%), Icelander (97.6%, a difference of 0.010%), Lumbee (97.6%, a difference of 0.010%), and Immigrants from Netherlands (97.6%, a difference of 0.020%).
| Demographics | Rating | Rank | 6th Grade |
| Cherokee | 99.4 /100 | #73 | Exceptional 97.6% |
| Immigrants | Netherlands | 99.4 /100 | #74 | Exceptional 97.6% |
| Ukrainians | 99.4 /100 | #75 | Exceptional 97.6% |
| Immigrants | England | 99.4 /100 | #76 | Exceptional 97.6% |
| Immigrants | Lithuania | 99.3 /100 | #77 | Exceptional 97.6% |
| Icelanders | 99.3 /100 | #78 | Exceptional 97.6% |
| Immigrants | India | 99.3 /100 | #79 | Exceptional 97.6% |
| Osage | 99.3 /100 | #80 | Exceptional 97.6% |
| Lumbee | 99.2 /100 | #81 | Exceptional 97.6% |
| Zimbabweans | 99.1 /100 | #82 | Exceptional 97.6% |
| Potawatomi | 99.1 /100 | #83 | Exceptional 97.6% |
| Shoshone | 99.0 /100 | #84 | Exceptional 97.6% |
| Delaware | 98.9 /100 | #85 | Exceptional 97.6% |
| Immigrants | Belgium | 98.9 /100 | #86 | Exceptional 97.5% |
| Puget Sound Salish | 98.9 /100 | #87 | Exceptional 97.5% |
Demographics Similar to Blacks/African Americans by 6th Grade
In terms of 6th grade, the demographic groups most similar to Blacks/African Americans are Guamanian/Chamorro (97.0%, a difference of 0.0%), Immigrants from Argentina (97.0%, a difference of 0.0%), Argentinean (97.0%, a difference of 0.010%), Immigrants from Egypt (97.0%, a difference of 0.010%), and Dutch West Indian (96.9%, a difference of 0.010%).
| Demographics | Rating | Rank | 6th Grade |
| Immigrants | Ukraine | 35.6 /100 | #182 | Fair 97.0% |
| Immigrants | Venezuela | 34.5 /100 | #183 | Fair 97.0% |
| Spanish Americans | 33.5 /100 | #184 | Fair 97.0% |
| Argentineans | 33.0 /100 | #185 | Fair 97.0% |
| Immigrants | Egypt | 31.4 /100 | #186 | Fair 97.0% |
| Guamanians/Chamorros | 30.6 /100 | #187 | Fair 97.0% |
| Immigrants | Argentina | 30.4 /100 | #188 | Fair 97.0% |
| Blacks/African Americans | 30.2 /100 | #189 | Fair 97.0% |
| Dutch West Indians | 28.3 /100 | #190 | Fair 96.9% |
| Panamanians | 27.3 /100 | #191 | Fair 96.9% |
| Hawaiians | 27.0 /100 | #192 | Fair 96.9% |
| Paraguayans | 26.6 /100 | #193 | Fair 96.9% |
| Immigrants | Lebanon | 25.6 /100 | #194 | Fair 96.9% |
| Immigrants | Brazil | 25.5 /100 | #195 | Fair 96.9% |
| Immigrants | Uganda | 21.2 /100 | #196 | Fair 96.9% |