Immigrants from Sri Lanka vs Tongan 1st Grade
COMPARE
Immigrants from Sri Lanka
Tongan
1st Grade
1st Grade Comparison
Immigrants from Sri Lanka
Tongans
97.9%
1ST GRADE
49.7/ 100
METRIC RATING
175th/ 347
METRIC RANK
97.7%
1ST GRADE
4.6/ 100
METRIC RATING
220th/ 347
METRIC RANK
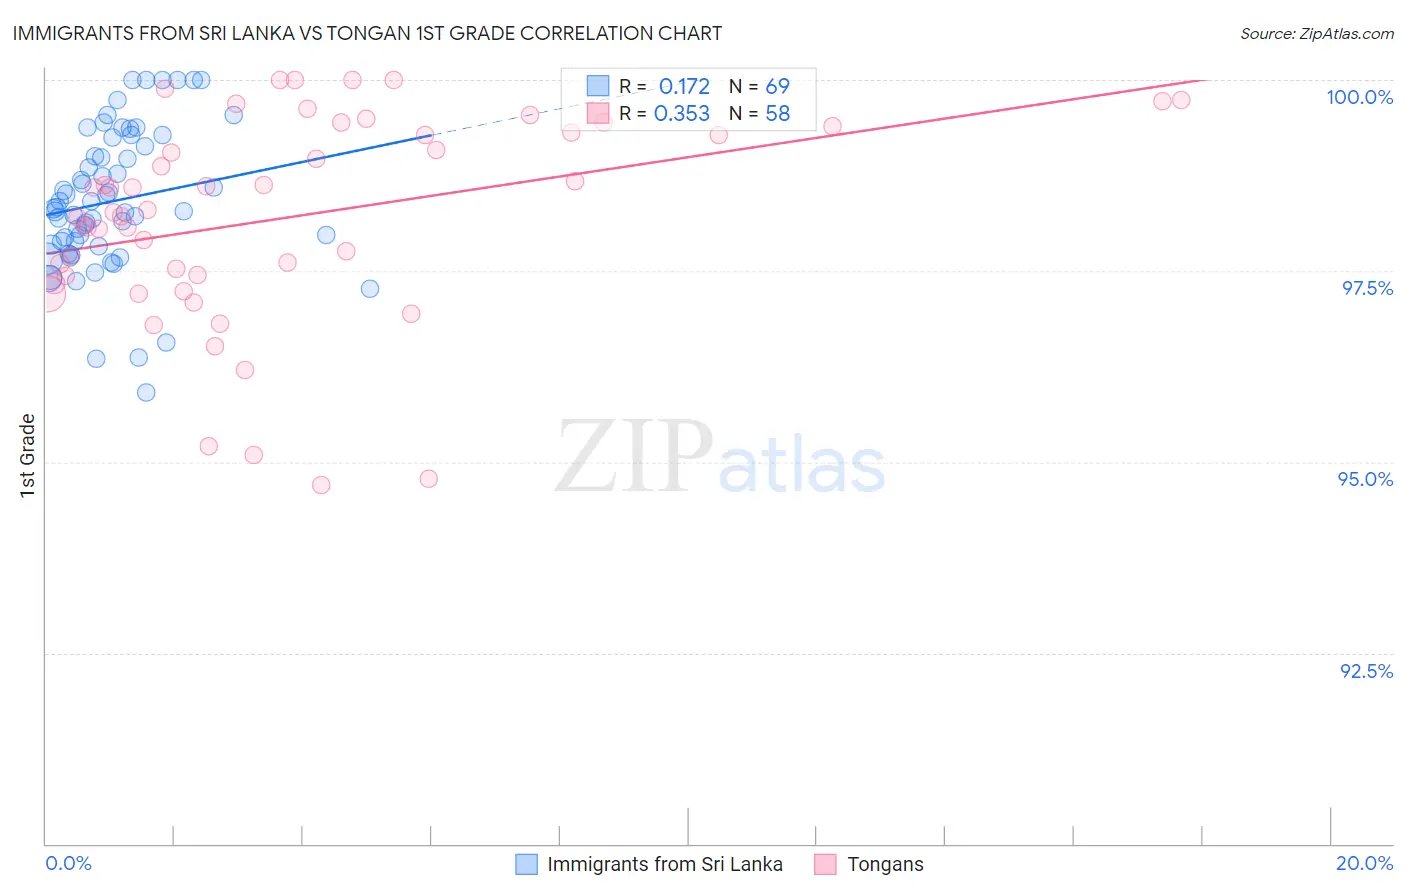
Immigrants from Sri Lanka vs Tongan 1st Grade Correlation Chart
The statistical analysis conducted on geographies consisting of 149,700,552 people shows a poor positive correlation between the proportion of Immigrants from Sri Lanka and percentage of population with at least 1st grade education in the United States with a correlation coefficient (R) of 0.172 and weighted average of 97.9%. Similarly, the statistical analysis conducted on geographies consisting of 102,908,759 people shows a mild positive correlation between the proportion of Tongans and percentage of population with at least 1st grade education in the United States with a correlation coefficient (R) of 0.353 and weighted average of 97.7%, a difference of 0.24%.
1st Grade Correlation Summary
| Measurement | Immigrants from Sri Lanka | Tongan |
| Minimum | 95.9% | 94.7% |
| Maximum | 100.0% | 100.0% |
| Range | 4.1% | 5.3% |
| Mean | 98.4% | 98.2% |
| Median | 98.3% | 98.3% |
| Interquartile 25% (IQ1) | 97.8% | 97.4% |
| Interquartile 75% (IQ3) | 99.2% | 99.3% |
| Interquartile Range (IQR) | 1.4% | 1.9% |
| Standard Deviation (Sample) | 0.93% | 1.3% |
| Standard Deviation (Population) | 0.92% | 1.3% |
Similar Demographics by 1st Grade
Demographics Similar to Immigrants from Sri Lanka by 1st Grade
In terms of 1st grade, the demographic groups most similar to Immigrants from Sri Lanka are Kenyan (97.9%, a difference of 0.0%), Native/Alaskan (97.9%, a difference of 0.0%), Albanian (97.9%, a difference of 0.0%), Immigrants from Brazil (97.9%, a difference of 0.0%), and Immigrants from Jordan (97.9%, a difference of 0.010%).
| Demographics | Rating | Rank | 1st Grade |
| Chileans | 55.6 /100 | #168 | Average 97.9% |
| Immigrants | Micronesia | 55.3 /100 | #169 | Average 97.9% |
| Immigrants | Spain | 54.9 /100 | #170 | Average 97.9% |
| Immigrants | Jordan | 53.9 /100 | #171 | Average 97.9% |
| Immigrants | Korea | 53.0 /100 | #172 | Average 97.9% |
| Kenyans | 51.2 /100 | #173 | Average 97.9% |
| Natives/Alaskans | 50.0 /100 | #174 | Average 97.9% |
| Immigrants | Sri Lanka | 49.7 /100 | #175 | Average 97.9% |
| Albanians | 49.6 /100 | #176 | Average 97.9% |
| Immigrants | Brazil | 49.1 /100 | #177 | Average 97.9% |
| Immigrants | Venezuela | 47.8 /100 | #178 | Average 97.9% |
| Argentineans | 47.2 /100 | #179 | Average 97.9% |
| Immigrants | Bosnia and Herzegovina | 46.6 /100 | #180 | Average 97.9% |
| Portuguese | 44.2 /100 | #181 | Average 97.9% |
| Egyptians | 42.7 /100 | #182 | Average 97.9% |
Demographics Similar to Tongans by 1st Grade
In terms of 1st grade, the demographic groups most similar to Tongans are Immigrants from Morocco (97.7%, a difference of 0.010%), Immigrants from Panama (97.7%, a difference of 0.010%), Immigrants from Sudan (97.7%, a difference of 0.010%), Immigrants from Syria (97.7%, a difference of 0.010%), and Immigrants from Zaire (97.7%, a difference of 0.010%).
| Demographics | Rating | Rank | 1st Grade |
| Immigrants | Bahamas | 8.1 /100 | #213 | Tragic 97.7% |
| South American Indians | 7.6 /100 | #214 | Tragic 97.7% |
| Bahamians | 7.5 /100 | #215 | Tragic 97.7% |
| Uruguayans | 7.4 /100 | #216 | Tragic 97.7% |
| Samoans | 6.8 /100 | #217 | Tragic 97.7% |
| Immigrants | Morocco | 5.3 /100 | #218 | Tragic 97.7% |
| Immigrants | Panama | 5.2 /100 | #219 | Tragic 97.7% |
| Tongans | 4.6 /100 | #220 | Tragic 97.7% |
| Immigrants | Sudan | 4.3 /100 | #221 | Tragic 97.7% |
| Immigrants | Syria | 4.2 /100 | #222 | Tragic 97.7% |
| Immigrants | Zaire | 4.1 /100 | #223 | Tragic 97.7% |
| Iraqis | 4.0 /100 | #224 | Tragic 97.7% |
| Immigrants | Nepal | 4.0 /100 | #225 | Tragic 97.7% |
| Sudanese | 3.7 /100 | #226 | Tragic 97.7% |
| Sierra Leoneans | 3.6 /100 | #227 | Tragic 97.7% |