Immigrants from Spain vs Central American Bachelor's Degree
COMPARE
Immigrants from Spain
Central American
Bachelor's Degree
Bachelor's Degree Comparison
Immigrants from Spain
Central Americans
44.3%
BACHELOR'S DEGREE
99.9/ 100
METRIC RATING
52nd/ 347
METRIC RANK
31.9%
BACHELOR'S DEGREE
0.2/ 100
METRIC RATING
271st/ 347
METRIC RANK
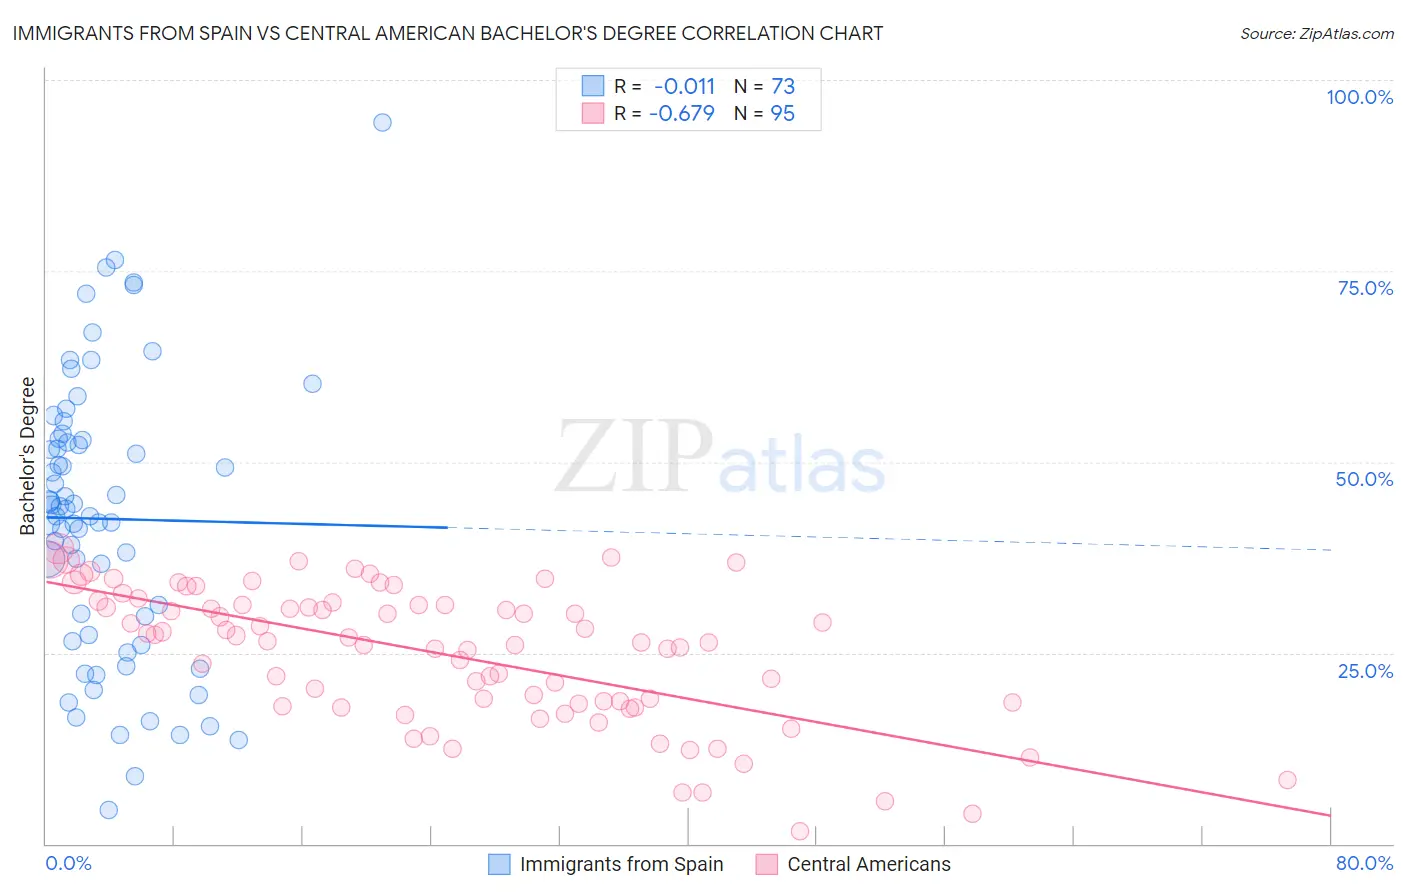
Immigrants from Spain vs Central American Bachelor's Degree Correlation Chart
The statistical analysis conducted on geographies consisting of 239,678,363 people shows no correlation between the proportion of Immigrants from Spain and percentage of population with at least bachelor's degree education in the United States with a correlation coefficient (R) of -0.011 and weighted average of 44.3%. Similarly, the statistical analysis conducted on geographies consisting of 504,521,400 people shows a significant negative correlation between the proportion of Central Americans and percentage of population with at least bachelor's degree education in the United States with a correlation coefficient (R) of -0.679 and weighted average of 31.9%, a difference of 38.9%.
Bachelor's Degree Correlation Summary
| Measurement | Immigrants from Spain | Central American |
| Minimum | 4.4% | 1.7% |
| Maximum | 94.4% | 38.7% |
| Range | 90.0% | 37.0% |
| Mean | 42.5% | 24.8% |
| Median | 43.9% | 26.5% |
| Interquartile 25% (IQ1) | 26.9% | 18.4% |
| Interquartile 75% (IQ3) | 52.9% | 31.3% |
| Interquartile Range (IQR) | 26.1% | 12.9% |
| Standard Deviation (Sample) | 18.3% | 8.9% |
| Standard Deviation (Population) | 18.2% | 8.8% |
Similar Demographics by Bachelor's Degree
Demographics Similar to Immigrants from Spain by Bachelor's Degree
In terms of bachelor's degree, the demographic groups most similar to Immigrants from Spain are Immigrants from Asia (44.3%, a difference of 0.060%), Asian (44.4%, a difference of 0.18%), Immigrants from Austria (44.2%, a difference of 0.24%), Immigrants from Bolivia (44.2%, a difference of 0.25%), and Immigrants from Greece (44.5%, a difference of 0.32%).
| Demographics | Rating | Rank | Bachelor's Degree |
| Immigrants | Kuwait | 99.9 /100 | #45 | Exceptional 44.6% |
| Immigrants | Bulgaria | 99.9 /100 | #46 | Exceptional 44.6% |
| Bolivians | 99.9 /100 | #47 | Exceptional 44.6% |
| Estonians | 99.9 /100 | #48 | Exceptional 44.6% |
| Immigrants | Norway | 99.9 /100 | #49 | Exceptional 44.5% |
| Immigrants | Greece | 99.9 /100 | #50 | Exceptional 44.5% |
| Asians | 99.9 /100 | #51 | Exceptional 44.4% |
| Immigrants | Spain | 99.9 /100 | #52 | Exceptional 44.3% |
| Immigrants | Asia | 99.9 /100 | #53 | Exceptional 44.3% |
| Immigrants | Austria | 99.9 /100 | #54 | Exceptional 44.2% |
| Immigrants | Bolivia | 99.9 /100 | #55 | Exceptional 44.2% |
| Immigrants | Serbia | 99.9 /100 | #56 | Exceptional 44.1% |
| Paraguayans | 99.9 /100 | #57 | Exceptional 44.0% |
| Immigrants | Czechoslovakia | 99.9 /100 | #58 | Exceptional 44.0% |
| Australians | 99.9 /100 | #59 | Exceptional 44.0% |
Demographics Similar to Central Americans by Bachelor's Degree
In terms of bachelor's degree, the demographic groups most similar to Central Americans are Comanche (31.9%, a difference of 0.030%), Immigrants from Nicaragua (31.9%, a difference of 0.090%), American (31.9%, a difference of 0.15%), Potawatomi (31.9%, a difference of 0.17%), and Samoan (31.8%, a difference of 0.30%).
| Demographics | Rating | Rank | Bachelor's Degree |
| Central American Indians | 0.3 /100 | #264 | Tragic 32.5% |
| Bahamians | 0.3 /100 | #265 | Tragic 32.5% |
| Immigrants | Dominica | 0.3 /100 | #266 | Tragic 32.5% |
| Cubans | 0.3 /100 | #267 | Tragic 32.5% |
| Immigrants | Portugal | 0.2 /100 | #268 | Tragic 32.2% |
| Immigrants | Belize | 0.2 /100 | #269 | Tragic 32.1% |
| Immigrants | Nicaragua | 0.2 /100 | #270 | Tragic 31.9% |
| Central Americans | 0.2 /100 | #271 | Tragic 31.9% |
| Comanche | 0.2 /100 | #272 | Tragic 31.9% |
| Americans | 0.2 /100 | #273 | Tragic 31.9% |
| Potawatomi | 0.2 /100 | #274 | Tragic 31.9% |
| Samoans | 0.1 /100 | #275 | Tragic 31.8% |
| Salvadorans | 0.1 /100 | #276 | Tragic 31.8% |
| Dominicans | 0.1 /100 | #277 | Tragic 31.8% |
| Marshallese | 0.1 /100 | #278 | Tragic 31.7% |