Immigrants from Southern Europe vs Asian 5th Grade
COMPARE
Immigrants from Southern Europe
Asian
5th Grade
5th Grade Comparison
Immigrants from Southern Europe
Asians
97.1%
5TH GRADE
6.3/ 100
METRIC RATING
220th/ 347
METRIC RANK
96.9%
5TH GRADE
2.0/ 100
METRIC RATING
238th/ 347
METRIC RANK
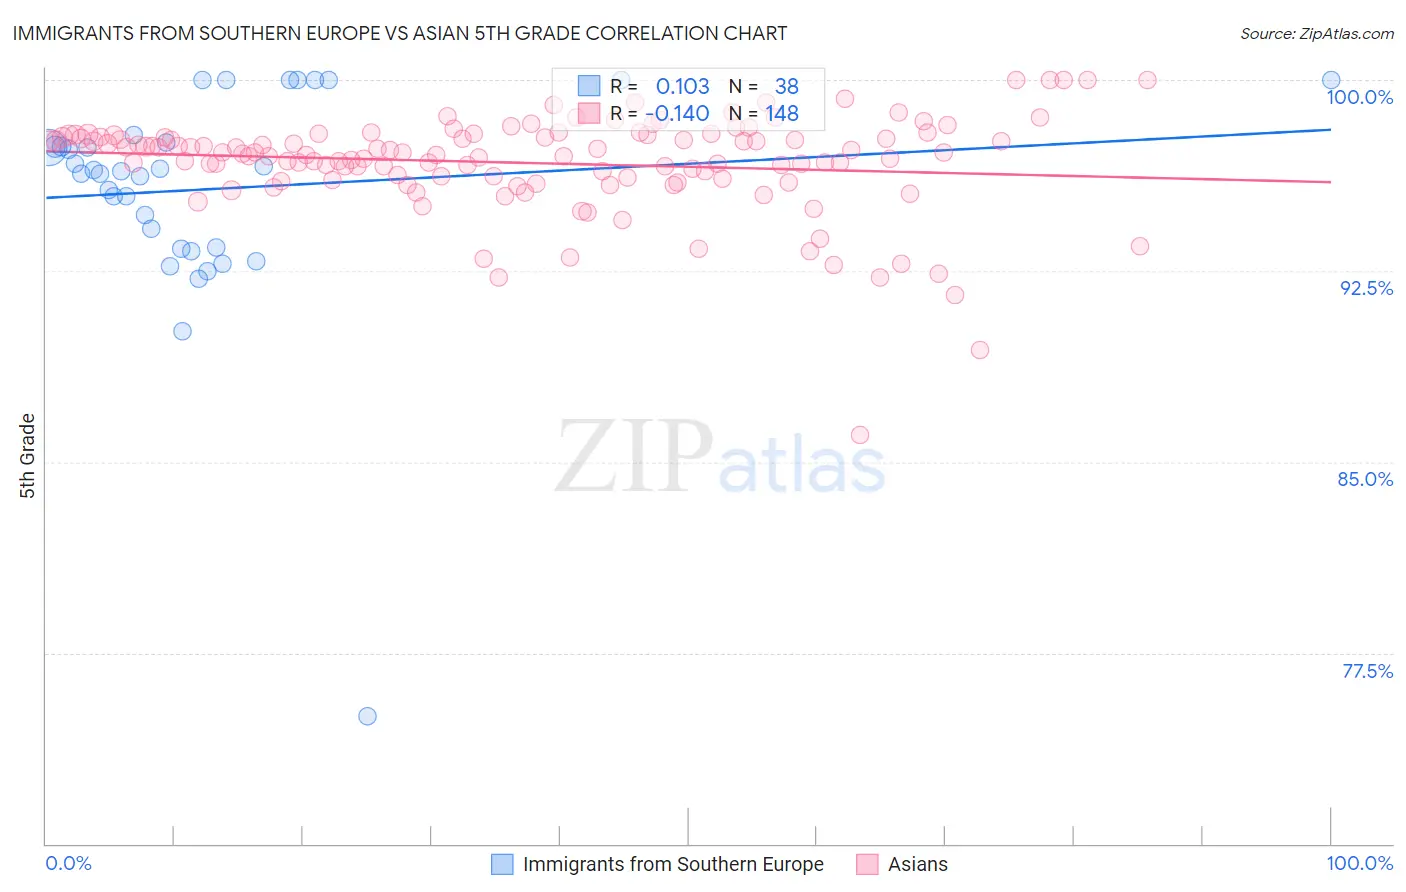
Immigrants from Southern Europe vs Asian 5th Grade Correlation Chart
The statistical analysis conducted on geographies consisting of 402,804,595 people shows a poor positive correlation between the proportion of Immigrants from Southern Europe and percentage of population with at least 5th grade education in the United States with a correlation coefficient (R) of 0.103 and weighted average of 97.1%. Similarly, the statistical analysis conducted on geographies consisting of 550,860,618 people shows a poor negative correlation between the proportion of Asians and percentage of population with at least 5th grade education in the United States with a correlation coefficient (R) of -0.140 and weighted average of 96.9%, a difference of 0.12%.
5th Grade Correlation Summary
| Measurement | Immigrants from Southern Europe | Asian |
| Minimum | 75.0% | 86.1% |
| Maximum | 100.0% | 100.0% |
| Range | 25.0% | 13.9% |
| Mean | 95.7% | 96.7% |
| Median | 96.5% | 97.1% |
| Interquartile 25% (IQ1) | 93.4% | 96.1% |
| Interquartile 75% (IQ3) | 97.5% | 97.8% |
| Interquartile Range (IQR) | 4.1% | 1.7% |
| Standard Deviation (Sample) | 4.4% | 1.9% |
| Standard Deviation (Population) | 4.3% | 1.9% |
Demographics Similar to Immigrants from Southern Europe and Asians by 5th Grade
In terms of 5th grade, the demographic groups most similar to Immigrants from Southern Europe are Immigrants from Syria (97.1%, a difference of 0.0%), Sierra Leonean (97.1%, a difference of 0.010%), Immigrants from Panama (97.0%, a difference of 0.010%), Liberian (97.0%, a difference of 0.010%), and South American Indian (97.0%, a difference of 0.020%). Similarly, the demographic groups most similar to Asians are Immigrants from Indonesia (96.9%, a difference of 0.0%), Nigerian (96.9%, a difference of 0.0%), Senegalese (97.0%, a difference of 0.030%), Tohono O'odham (97.0%, a difference of 0.050%), and Uruguayan (97.0%, a difference of 0.050%).
| Demographics | Rating | Rank | 5th Grade |
| Immigrants | Syria | 6.4 /100 | #219 | Tragic 97.1% |
| Immigrants | Southern Europe | 6.3 /100 | #220 | Tragic 97.1% |
| Sierra Leoneans | 6.0 /100 | #221 | Tragic 97.1% |
| Immigrants | Panama | 5.7 /100 | #222 | Tragic 97.0% |
| Liberians | 5.7 /100 | #223 | Tragic 97.0% |
| South American Indians | 5.4 /100 | #224 | Tragic 97.0% |
| Bahamians | 5.3 /100 | #225 | Tragic 97.0% |
| Tongans | 5.3 /100 | #226 | Tragic 97.0% |
| Immigrants | Pakistan | 4.7 /100 | #227 | Tragic 97.0% |
| Assyrians/Chaldeans/Syriacs | 4.5 /100 | #228 | Tragic 97.0% |
| Yuman | 4.5 /100 | #229 | Tragic 97.0% |
| Immigrants | Western Asia | 4.3 /100 | #230 | Tragic 97.0% |
| Immigrants | Malaysia | 4.1 /100 | #231 | Tragic 97.0% |
| Immigrants | Eastern Asia | 4.0 /100 | #232 | Tragic 97.0% |
| Sub-Saharan Africans | 3.3 /100 | #233 | Tragic 97.0% |
| Tohono O'odham | 3.2 /100 | #234 | Tragic 97.0% |
| Uruguayans | 3.2 /100 | #235 | Tragic 97.0% |
| Senegalese | 2.8 /100 | #236 | Tragic 97.0% |
| Immigrants | Indonesia | 2.0 /100 | #237 | Tragic 96.9% |
| Asians | 2.0 /100 | #238 | Tragic 96.9% |
| Nigerians | 1.9 /100 | #239 | Tragic 96.9% |