Immigrants from Southern Europe vs Immigrants from Northern Africa 5th Grade
COMPARE
Immigrants from Southern Europe
Immigrants from Northern Africa
5th Grade
5th Grade Comparison
Immigrants from Southern Europe
Immigrants from Northern Africa
97.1%
5TH GRADE
6.3/ 100
METRIC RATING
220th/ 347
METRIC RANK
97.2%
5TH GRADE
16.8/ 100
METRIC RATING
200th/ 347
METRIC RANK
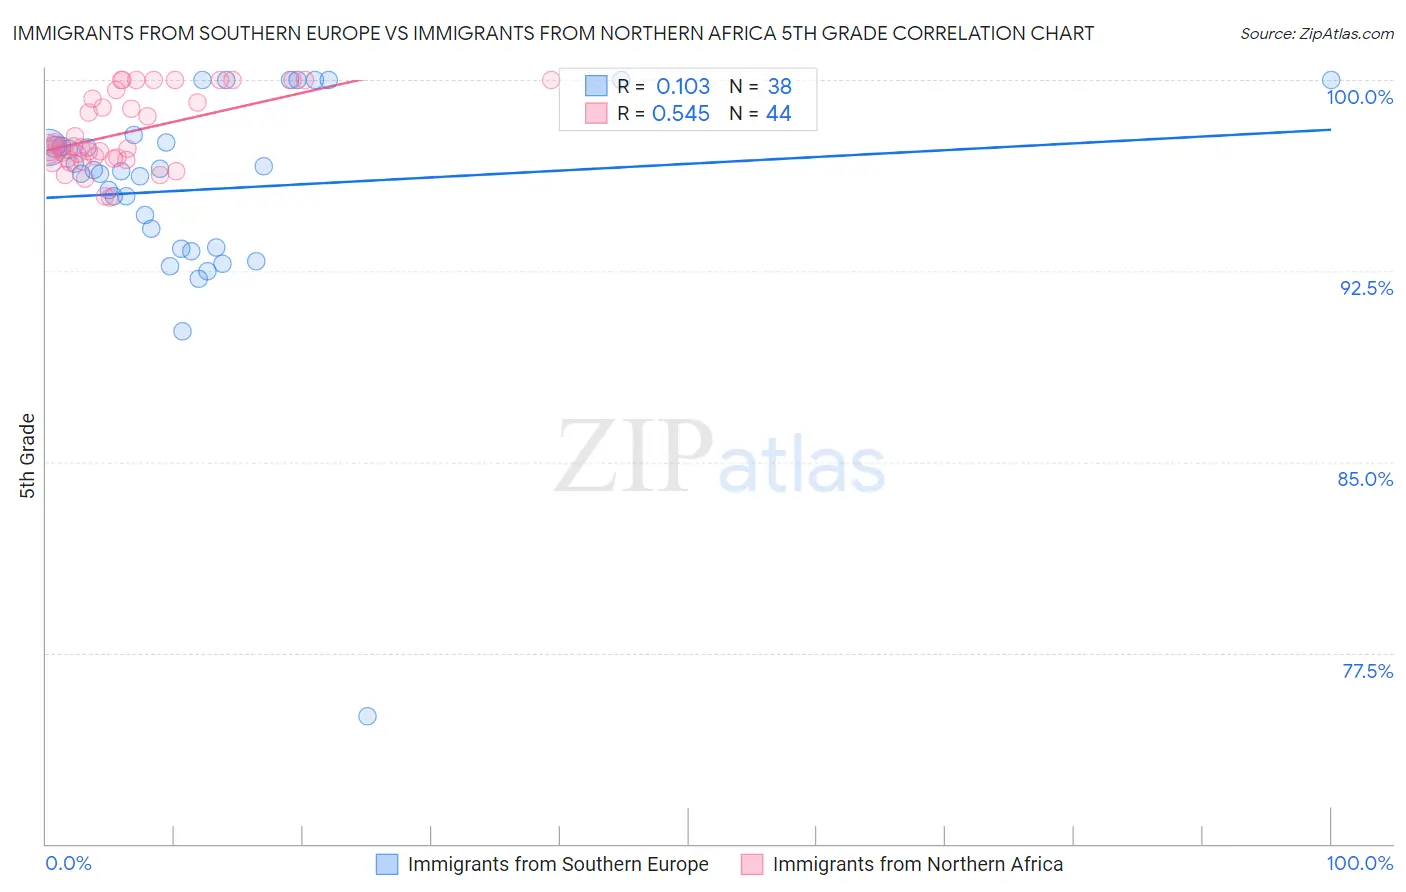
Immigrants from Southern Europe vs Immigrants from Northern Africa 5th Grade Correlation Chart
The statistical analysis conducted on geographies consisting of 402,804,595 people shows a poor positive correlation between the proportion of Immigrants from Southern Europe and percentage of population with at least 5th grade education in the United States with a correlation coefficient (R) of 0.103 and weighted average of 97.1%. Similarly, the statistical analysis conducted on geographies consisting of 321,196,768 people shows a substantial positive correlation between the proportion of Immigrants from Northern Africa and percentage of population with at least 5th grade education in the United States with a correlation coefficient (R) of 0.545 and weighted average of 97.2%, a difference of 0.12%.
5th Grade Correlation Summary
| Measurement | Immigrants from Southern Europe | Immigrants from Northern Africa |
| Minimum | 75.0% | 95.4% |
| Maximum | 100.0% | 100.0% |
| Range | 25.0% | 4.6% |
| Mean | 95.7% | 97.9% |
| Median | 96.5% | 97.3% |
| Interquartile 25% (IQ1) | 93.4% | 96.9% |
| Interquartile 75% (IQ3) | 97.5% | 99.4% |
| Interquartile Range (IQR) | 4.1% | 2.5% |
| Standard Deviation (Sample) | 4.4% | 1.4% |
| Standard Deviation (Population) | 4.3% | 1.4% |
Demographics Similar to Immigrants from Southern Europe and Immigrants from Northern Africa by 5th Grade
In terms of 5th grade, the demographic groups most similar to Immigrants from Southern Europe are Immigrants from Sudan (97.1%, a difference of 0.0%), Immigrants from Syria (97.1%, a difference of 0.0%), Sudanese (97.1%, a difference of 0.010%), Immigrants from Lebanon (97.1%, a difference of 0.010%), and Portuguese (97.1%, a difference of 0.020%). Similarly, the demographic groups most similar to Immigrants from Northern Africa are Immigrants from Chile (97.2%, a difference of 0.0%), African (97.2%, a difference of 0.010%), Immigrants from Bahamas (97.2%, a difference of 0.010%), Immigrants from Zaire (97.1%, a difference of 0.020%), and Moroccan (97.1%, a difference of 0.040%).
| Demographics | Rating | Rank | 5th Grade |
| Immigrants | Northern Africa | 16.8 /100 | #200 | Poor 97.2% |
| Immigrants | Chile | 16.6 /100 | #201 | Poor 97.2% |
| Africans | 15.3 /100 | #202 | Poor 97.2% |
| Immigrants | Bahamas | 14.9 /100 | #203 | Poor 97.2% |
| Immigrants | Zaire | 13.7 /100 | #204 | Poor 97.1% |
| Moroccans | 12.0 /100 | #205 | Poor 97.1% |
| Paiute | 11.6 /100 | #206 | Poor 97.1% |
| Iraqis | 10.9 /100 | #207 | Poor 97.1% |
| Laotians | 10.8 /100 | #208 | Poor 97.1% |
| Immigrants | Nepal | 10.3 /100 | #209 | Poor 97.1% |
| Immigrants | Oceania | 10.0 /100 | #210 | Poor 97.1% |
| Samoans | 8.5 /100 | #211 | Tragic 97.1% |
| Immigrants | Iraq | 8.3 /100 | #212 | Tragic 97.1% |
| Portuguese | 7.8 /100 | #213 | Tragic 97.1% |
| Costa Ricans | 7.7 /100 | #214 | Tragic 97.1% |
| Immigrants | Morocco | 7.5 /100 | #215 | Tragic 97.1% |
| Sudanese | 7.0 /100 | #216 | Tragic 97.1% |
| Immigrants | Lebanon | 6.8 /100 | #217 | Tragic 97.1% |
| Immigrants | Sudan | 6.5 /100 | #218 | Tragic 97.1% |
| Immigrants | Syria | 6.4 /100 | #219 | Tragic 97.1% |
| Immigrants | Southern Europe | 6.3 /100 | #220 | Tragic 97.1% |