Immigrants from South Central Asia vs Immigrants from Western Africa 10th Grade
COMPARE
Immigrants from South Central Asia
Immigrants from Western Africa
10th Grade
10th Grade Comparison
Immigrants from South Central Asia
Immigrants from Western Africa
94.5%
10TH GRADE
97.8/ 100
METRIC RATING
100th/ 347
METRIC RANK
92.5%
10TH GRADE
0.3/ 100
METRIC RATING
272nd/ 347
METRIC RANK
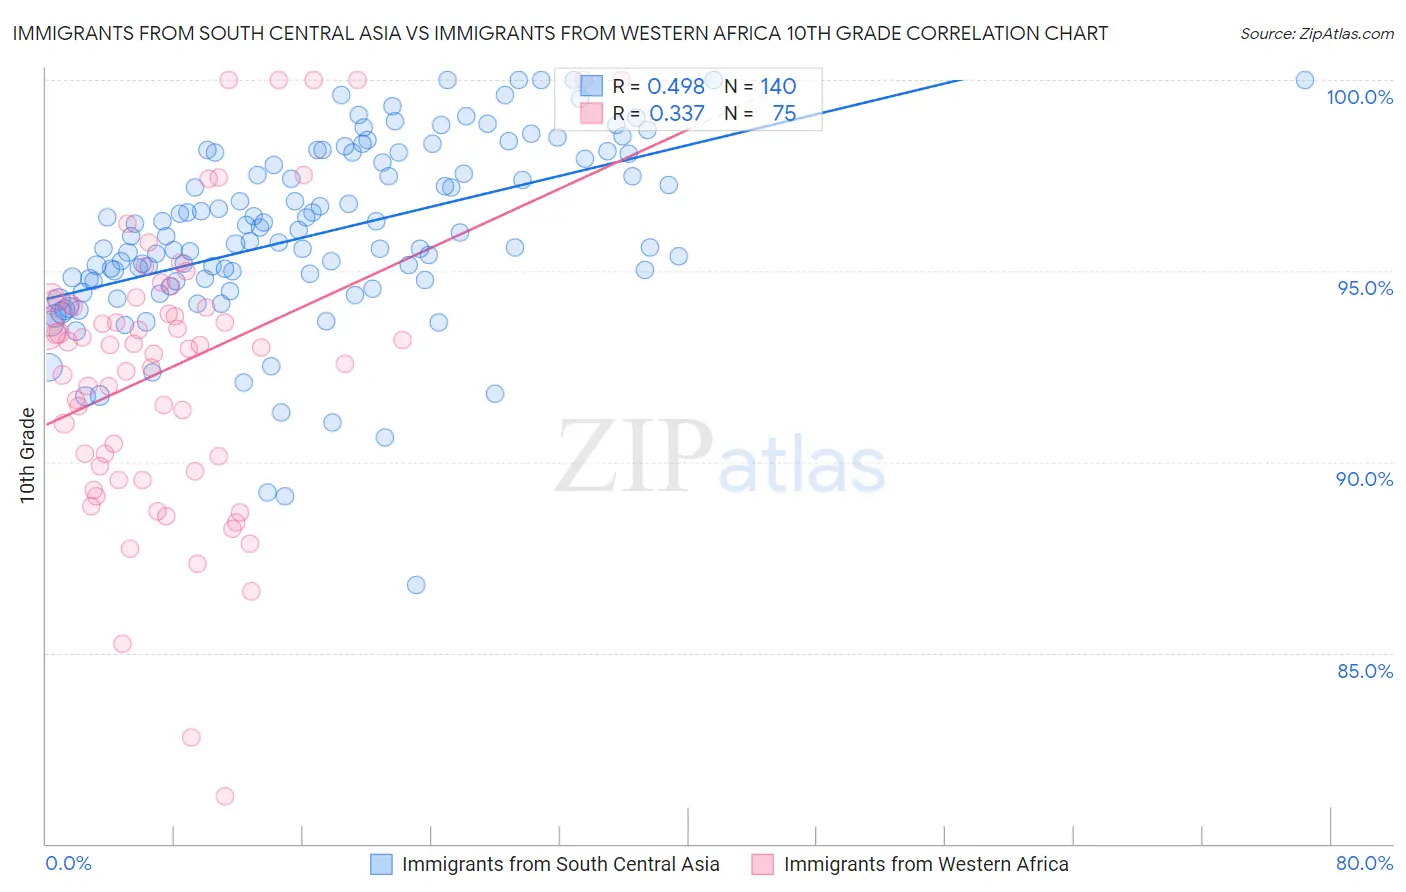
Immigrants from South Central Asia vs Immigrants from Western Africa 10th Grade Correlation Chart
The statistical analysis conducted on geographies consisting of 473,113,181 people shows a moderate positive correlation between the proportion of Immigrants from South Central Asia and percentage of population with at least 10th grade education in the United States with a correlation coefficient (R) of 0.498 and weighted average of 94.5%. Similarly, the statistical analysis conducted on geographies consisting of 357,883,667 people shows a mild positive correlation between the proportion of Immigrants from Western Africa and percentage of population with at least 10th grade education in the United States with a correlation coefficient (R) of 0.337 and weighted average of 92.5%, a difference of 2.2%.
10th Grade Correlation Summary
| Measurement | Immigrants from South Central Asia | Immigrants from Western Africa |
| Minimum | 86.8% | 81.2% |
| Maximum | 100.0% | 100.0% |
| Range | 13.2% | 18.8% |
| Mean | 96.0% | 92.5% |
| Median | 95.8% | 93.1% |
| Interquartile 25% (IQ1) | 94.7% | 89.9% |
| Interquartile 75% (IQ3) | 98.0% | 94.2% |
| Interquartile Range (IQR) | 3.3% | 4.3% |
| Standard Deviation (Sample) | 2.4% | 3.8% |
| Standard Deviation (Population) | 2.4% | 3.7% |
Similar Demographics by 10th Grade
Demographics Similar to Immigrants from South Central Asia by 10th Grade
In terms of 10th grade, the demographic groups most similar to Immigrants from South Central Asia are Syrian (94.5%, a difference of 0.0%), Cambodian (94.5%, a difference of 0.010%), Immigrants from France (94.5%, a difference of 0.020%), Immigrants from Bulgaria (94.6%, a difference of 0.030%), and Immigrants from Europe (94.5%, a difference of 0.030%).
| Demographics | Rating | Rank | 10th Grade |
| Soviet Union | 98.3 /100 | #93 | Exceptional 94.6% |
| Immigrants | Germany | 98.3 /100 | #94 | Exceptional 94.6% |
| Menominee | 98.3 /100 | #95 | Exceptional 94.6% |
| Immigrants | Switzerland | 98.3 /100 | #96 | Exceptional 94.6% |
| Lebanese | 98.3 /100 | #97 | Exceptional 94.6% |
| Immigrants | Bulgaria | 98.1 /100 | #98 | Exceptional 94.6% |
| Immigrants | France | 97.9 /100 | #99 | Exceptional 94.5% |
| Immigrants | South Central Asia | 97.8 /100 | #100 | Exceptional 94.5% |
| Syrians | 97.7 /100 | #101 | Exceptional 94.5% |
| Cambodians | 97.6 /100 | #102 | Exceptional 94.5% |
| Immigrants | Europe | 97.5 /100 | #103 | Exceptional 94.5% |
| Immigrants | Romania | 97.5 /100 | #104 | Exceptional 94.5% |
| Immigrants | Turkey | 97.4 /100 | #105 | Exceptional 94.5% |
| Immigrants | Serbia | 97.4 /100 | #106 | Exceptional 94.5% |
| Immigrants | Croatia | 97.4 /100 | #107 | Exceptional 94.5% |
Demographics Similar to Immigrants from Western Africa by 10th Grade
In terms of 10th grade, the demographic groups most similar to Immigrants from Western Africa are Immigrants from Eritrea (92.5%, a difference of 0.010%), Immigrants from Colombia (92.5%, a difference of 0.020%), Immigrants from Uruguay (92.5%, a difference of 0.020%), Taiwanese (92.5%, a difference of 0.040%), and Immigrants from Ghana (92.5%, a difference of 0.040%).
| Demographics | Rating | Rank | 10th Grade |
| Dutch West Indians | 0.4 /100 | #265 | Tragic 92.6% |
| Immigrants | Philippines | 0.4 /100 | #266 | Tragic 92.6% |
| Taiwanese | 0.3 /100 | #267 | Tragic 92.5% |
| Immigrants | Ghana | 0.3 /100 | #268 | Tragic 92.5% |
| Immigrants | Colombia | 0.3 /100 | #269 | Tragic 92.5% |
| Immigrants | Uruguay | 0.3 /100 | #270 | Tragic 92.5% |
| Immigrants | Eritrea | 0.3 /100 | #271 | Tragic 92.5% |
| Immigrants | Western Africa | 0.3 /100 | #272 | Tragic 92.5% |
| Trinidadians and Tobagonians | 0.2 /100 | #273 | Tragic 92.4% |
| Immigrants | Congo | 0.2 /100 | #274 | Tragic 92.4% |
| West Indians | 0.2 /100 | #275 | Tragic 92.4% |
| Immigrants | Trinidad and Tobago | 0.1 /100 | #276 | Tragic 92.3% |
| Navajo | 0.1 /100 | #277 | Tragic 92.3% |
| Barbadians | 0.1 /100 | #278 | Tragic 92.2% |
| Natives/Alaskans | 0.1 /100 | #279 | Tragic 92.2% |