Mexican American Indian vs Immigrants from Western Africa 10th Grade
COMPARE
Mexican American Indian
Immigrants from Western Africa
10th Grade
10th Grade Comparison
Mexican American Indians
Immigrants from Western Africa
89.0%
10TH GRADE
0.0/ 100
METRIC RATING
331st/ 347
METRIC RANK
92.5%
10TH GRADE
0.3/ 100
METRIC RATING
272nd/ 347
METRIC RANK
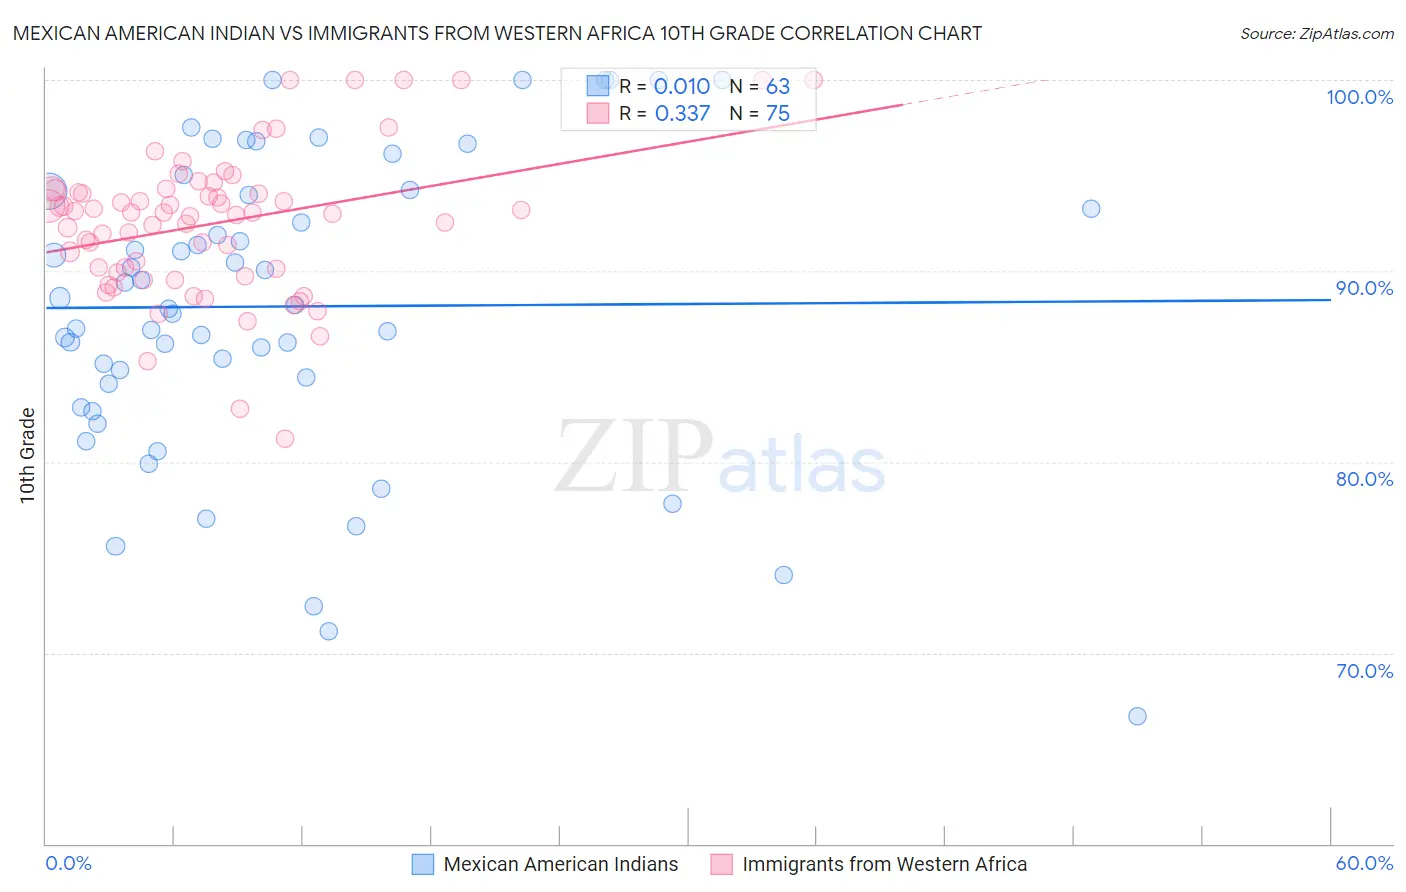
Mexican American Indian vs Immigrants from Western Africa 10th Grade Correlation Chart
The statistical analysis conducted on geographies consisting of 317,621,155 people shows no correlation between the proportion of Mexican American Indians and percentage of population with at least 10th grade education in the United States with a correlation coefficient (R) of 0.010 and weighted average of 89.0%. Similarly, the statistical analysis conducted on geographies consisting of 357,883,667 people shows a mild positive correlation between the proportion of Immigrants from Western Africa and percentage of population with at least 10th grade education in the United States with a correlation coefficient (R) of 0.337 and weighted average of 92.5%, a difference of 3.9%.
10th Grade Correlation Summary
| Measurement | Mexican American Indian | Immigrants from Western Africa |
| Minimum | 66.7% | 81.2% |
| Maximum | 100.0% | 100.0% |
| Range | 33.3% | 18.8% |
| Mean | 88.1% | 92.5% |
| Median | 88.2% | 93.1% |
| Interquartile 25% (IQ1) | 84.1% | 89.9% |
| Interquartile 75% (IQ3) | 94.2% | 94.2% |
| Interquartile Range (IQR) | 10.1% | 4.3% |
| Standard Deviation (Sample) | 7.8% | 3.8% |
| Standard Deviation (Population) | 7.8% | 3.7% |
Similar Demographics by 10th Grade
Demographics Similar to Mexican American Indians by 10th Grade
In terms of 10th grade, the demographic groups most similar to Mexican American Indians are Immigrants from Yemen (89.1%, a difference of 0.030%), Immigrants from the Azores (89.0%, a difference of 0.040%), Honduran (89.0%, a difference of 0.070%), Hispanic or Latino (88.9%, a difference of 0.19%), and Immigrants from Dominican Republic (88.7%, a difference of 0.37%).
| Demographics | Rating | Rank | 10th Grade |
| Immigrants | Armenia | 0.0 /100 | #324 | Tragic 89.9% |
| Puerto Ricans | 0.0 /100 | #325 | Tragic 89.8% |
| Central American Indians | 0.0 /100 | #326 | Tragic 89.7% |
| Immigrants | Nicaragua | 0.0 /100 | #327 | Tragic 89.5% |
| Immigrants | Cabo Verde | 0.0 /100 | #328 | Tragic 89.5% |
| Dominicans | 0.0 /100 | #329 | Tragic 89.4% |
| Immigrants | Yemen | 0.0 /100 | #330 | Tragic 89.1% |
| Mexican American Indians | 0.0 /100 | #331 | Tragic 89.0% |
| Immigrants | Azores | 0.0 /100 | #332 | Tragic 89.0% |
| Hondurans | 0.0 /100 | #333 | Tragic 89.0% |
| Hispanics or Latinos | 0.0 /100 | #334 | Tragic 88.9% |
| Immigrants | Dominican Republic | 0.0 /100 | #335 | Tragic 88.7% |
| Immigrants | Honduras | 0.0 /100 | #336 | Tragic 88.5% |
| Central Americans | 0.0 /100 | #337 | Tragic 88.4% |
| Immigrants | Latin America | 0.0 /100 | #338 | Tragic 88.3% |
Demographics Similar to Immigrants from Western Africa by 10th Grade
In terms of 10th grade, the demographic groups most similar to Immigrants from Western Africa are Immigrants from Eritrea (92.5%, a difference of 0.010%), Immigrants from Colombia (92.5%, a difference of 0.020%), Immigrants from Uruguay (92.5%, a difference of 0.020%), Taiwanese (92.5%, a difference of 0.040%), and Immigrants from Ghana (92.5%, a difference of 0.040%).
| Demographics | Rating | Rank | 10th Grade |
| Dutch West Indians | 0.4 /100 | #265 | Tragic 92.6% |
| Immigrants | Philippines | 0.4 /100 | #266 | Tragic 92.6% |
| Taiwanese | 0.3 /100 | #267 | Tragic 92.5% |
| Immigrants | Ghana | 0.3 /100 | #268 | Tragic 92.5% |
| Immigrants | Colombia | 0.3 /100 | #269 | Tragic 92.5% |
| Immigrants | Uruguay | 0.3 /100 | #270 | Tragic 92.5% |
| Immigrants | Eritrea | 0.3 /100 | #271 | Tragic 92.5% |
| Immigrants | Western Africa | 0.3 /100 | #272 | Tragic 92.5% |
| Trinidadians and Tobagonians | 0.2 /100 | #273 | Tragic 92.4% |
| Immigrants | Congo | 0.2 /100 | #274 | Tragic 92.4% |
| West Indians | 0.2 /100 | #275 | Tragic 92.4% |
| Immigrants | Trinidad and Tobago | 0.1 /100 | #276 | Tragic 92.3% |
| Navajo | 0.1 /100 | #277 | Tragic 92.3% |
| Barbadians | 0.1 /100 | #278 | Tragic 92.2% |
| Natives/Alaskans | 0.1 /100 | #279 | Tragic 92.2% |