Immigrants from South Central Asia vs Albanian 1st Grade
COMPARE
Immigrants from South Central Asia
Albanian
1st Grade
1st Grade Comparison
Immigrants from South Central Asia
Albanians
98.0%
1ST GRADE
66.2/ 100
METRIC RATING
156th/ 347
METRIC RANK
97.9%
1ST GRADE
49.6/ 100
METRIC RATING
176th/ 347
METRIC RANK
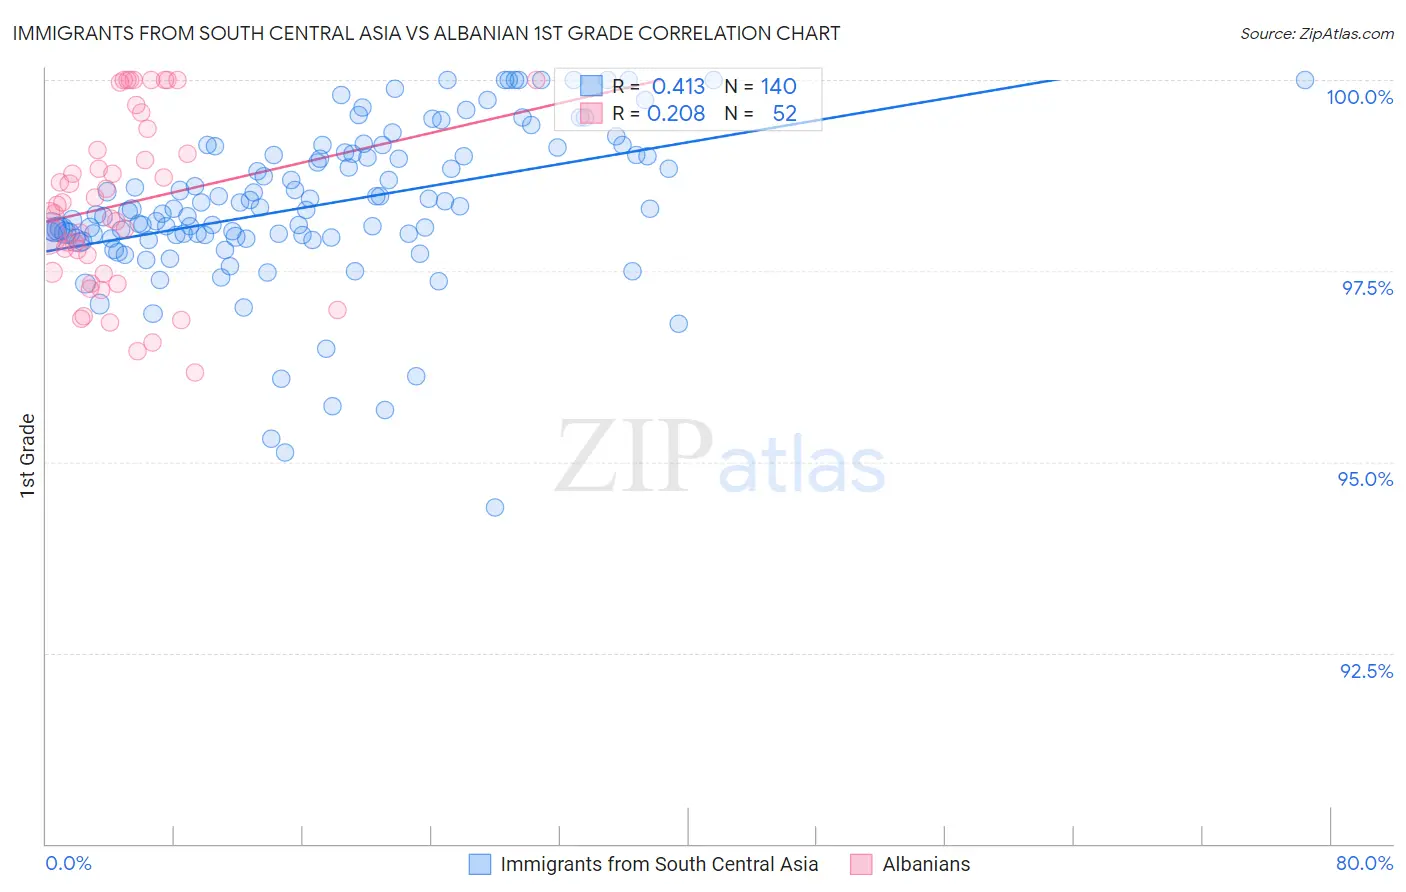
Immigrants from South Central Asia vs Albanian 1st Grade Correlation Chart
The statistical analysis conducted on geographies consisting of 473,113,181 people shows a moderate positive correlation between the proportion of Immigrants from South Central Asia and percentage of population with at least 1st grade education in the United States with a correlation coefficient (R) of 0.413 and weighted average of 98.0%. Similarly, the statistical analysis conducted on geographies consisting of 193,265,850 people shows a weak positive correlation between the proportion of Albanians and percentage of population with at least 1st grade education in the United States with a correlation coefficient (R) of 0.208 and weighted average of 97.9%, a difference of 0.050%.
1st Grade Correlation Summary
| Measurement | Immigrants from South Central Asia | Albanian |
| Minimum | 94.4% | 96.2% |
| Maximum | 100.0% | 100.0% |
| Range | 5.6% | 3.8% |
| Mean | 98.4% | 98.4% |
| Median | 98.3% | 98.3% |
| Interquartile 25% (IQ1) | 97.9% | 97.5% |
| Interquartile 75% (IQ3) | 99.0% | 99.2% |
| Interquartile Range (IQR) | 1.1% | 1.8% |
| Standard Deviation (Sample) | 1.0% | 1.1% |
| Standard Deviation (Population) | 1.0% | 1.1% |
Demographics Similar to Immigrants from South Central Asia and Albanians by 1st Grade
In terms of 1st grade, the demographic groups most similar to Immigrants from South Central Asia are Immigrants from North Macedonia (98.0%, a difference of 0.0%), Venezuelan (98.0%, a difference of 0.010%), French American Indian (98.0%, a difference of 0.010%), Immigrants from Russia (97.9%, a difference of 0.020%), and Immigrants from Italy (97.9%, a difference of 0.020%). Similarly, the demographic groups most similar to Albanians are Kenyan (97.9%, a difference of 0.0%), Native/Alaskan (97.9%, a difference of 0.0%), Immigrants from Sri Lanka (97.9%, a difference of 0.0%), Immigrants from Jordan (97.9%, a difference of 0.010%), and Immigrants from Korea (97.9%, a difference of 0.010%).
| Demographics | Rating | Rank | 1st Grade |
| Immigrants | South Central Asia | 66.2 /100 | #156 | Good 98.0% |
| Immigrants | North Macedonia | 65.3 /100 | #157 | Good 98.0% |
| Venezuelans | 64.7 /100 | #158 | Good 98.0% |
| French American Indians | 63.7 /100 | #159 | Good 98.0% |
| Immigrants | Russia | 59.2 /100 | #160 | Average 97.9% |
| Immigrants | Italy | 59.1 /100 | #161 | Average 97.9% |
| Immigrants | Eastern Europe | 58.9 /100 | #162 | Average 97.9% |
| Spanish Americans | 57.7 /100 | #163 | Average 97.9% |
| Brazilians | 57.6 /100 | #164 | Average 97.9% |
| Ugandans | 56.9 /100 | #165 | Average 97.9% |
| Navajo | 56.6 /100 | #166 | Average 97.9% |
| Bermudans | 56.3 /100 | #167 | Average 97.9% |
| Chileans | 55.6 /100 | #168 | Average 97.9% |
| Immigrants | Micronesia | 55.3 /100 | #169 | Average 97.9% |
| Immigrants | Spain | 54.9 /100 | #170 | Average 97.9% |
| Immigrants | Jordan | 53.9 /100 | #171 | Average 97.9% |
| Immigrants | Korea | 53.0 /100 | #172 | Average 97.9% |
| Kenyans | 51.2 /100 | #173 | Average 97.9% |
| Natives/Alaskans | 50.0 /100 | #174 | Average 97.9% |
| Immigrants | Sri Lanka | 49.7 /100 | #175 | Average 97.9% |
| Albanians | 49.6 /100 | #176 | Average 97.9% |